logstash + elasticsearch + Kibana+Redis+Syslog-ng
ElasticSearch是一个基于Lucene构建的开源,分布式,RESTful搜索引擎。设计用于云计算中,能够达到实时搜索,稳定,可靠,快速,安装使用方便。支持通过HTTP使用JSON进行数据索引。
logstash是一个应用程序日志、事件的传输、处理、管理和搜索的平台。你可以用它来统一对应用程序日志进行收集管理,提供 Web 接口用于查询和统计。其实logstash是可以被别的替换,比如常见的fluented
Kibana是一个为 Logstash 和 ElasticSearch 提供的日志分析的 Web 接口。可使用它对日志进行高效的搜索、可视化、分析等各种操作。
Redis是一个高性能的内存key-value数据库,非必需安装,可以防止数据丢失.

参考:
http://www.logstash.net/
http://chenlinux.com/2012/10/21/elasticearch-simple-usage/
http://www.elasticsearch.cn
http://download.oracle.com/otn-pub/java/jdk/7u67-b01/jdk-7u67-linux-x64.tar.gz?AuthParam=1408083909_3bf5b46169faab84d36cf74407132bba
http://curran.blog.51cto.com/2788306/1263416
http://storysky.blog.51cto.com/628458/1158707/
http://zhumeng8337797.blog.163.com/blog/static/10076891420142712316899/
http://enable.blog.51cto.com/747951/1049411
http://chenlinux.com/2014/06/11/nginx-access-log-to-elasticsearch/
http://www.w3c.com.cn/%E5%BC%80%E6%BA%90%E5%88%86%E5%B8%83%E5%BC%8F%E6%90%9C%E7%B4%A2%E5%B9%B3%E5%8F%B0elkelasticsearchlogstashkibana%E5%85%A5%E9%97%A8%E5%AD%A6%E4%B9%A0%E8%B5%84%E6%BA%90%E7%B4%A2%E5%BC%95
http://woodygsd.blogspot.com/2014/06/an-adventure-with-elk-or-how-to-replace.html
http://www.ricardomartins.com.br/enviando-dados-externos-para-a-stack-elk/
http://tinytub.github.io/logstash-install.html
http://jamesmcfadden.co.uk/securing-elasticsearch-with-nginx/
https://github.com/elasticsearch/logstash/blob/master/patterns/grok-patterns
http://zhaoyanblog.com/archives/319.html
http://www.vpsee.com/2014/05/install-and-play-with-elasticsearch/
ip说明
118.x.x.x/16 为客户端ip
192.168.0.39和61.x.x.x为ELK的内网和外网ip
安装JDK
http://www.oracle.com/technetwork/java/javase/downloads/jdk7-downloads-1880260.html
- tar zxvf jdk-7u67-linux-x64.tar.gz\?AuthParam\=1408083909_3bf5b46169faab84d36cf74407132b
- mv jdk1.7.0_67 /usr/local/
- cd /usr/local/
- ln -s jdk1.7.0_67 jdk
- chown -R root:root jdk/
配置环境变量
vi /etc/profile
- export JAVA_HOME=/usr/local/jdk
- export JRE_HOME=$JAVA_HOME/jre
- export CLASSPATH=.:$JAVA_HOME/lib/dt.jar:$JAVA_HOME/lib/tools.jar:$JRE_HOME/lib:$CLASSPATH
- export PATH=$JAVA_HOME/bin:$PATH
- export REDIS_HOME=/usr/local/redis
- export ES_HOME=/usr/local/elasticsearch
- export ES_CLASSPATH=$ES_HOME/config
变量生效
source /etc/profile
验证版本
java -version
- java version “1.7.0_67”
- Java(TM) SE Runtime Environment (build 1.7.0_67-b01)
- Java HotSpot(TM) 64-Bit Server VM (build 24.65-b04, mixed mode)
如果之前安装过java,可以先卸载
rpm -qa |grep java
java-1.6.0-openjdk-1.6.0.0-1.24.1.10.4.el5
java-1.6.0-openjdk-devel-1.6.0.0-1.24.1.10.4.el5
rpm -e java-1.6.0-openjdk-1.6.0.0-1.24.1.10.4.el5 java-1.6.0-openjdk-devel-1.6.0.0-1.24.1.10.4.el5
安装redis
http://redis.io/
- wget http://download.redis.io/releases/redis-2.6.17.tar.gz
- tar zxvf redis-2.6.17.tar.gz
- mv redis-2.6.17 /usr/local/
- cd /usr/local
- ln -s redis-2.6.17 redis
- cd /usr/local/redis
- make
- make install
cd utils
./install_server.sh
- Please select the redis port for this instance: [6379]
- Selecting default: 6379
- Please select the redis config file name [/etc/redis/6379.conf]
- Selected default – /etc/redis/6379.conf
- Please select the redis log file name [/var/log/redis_6379.log]
- Selected default – /var/log/redis_6379.log
- Please select the data directory for this instance [/var/lib/redis/6379]
- Selected default – /var/lib/redis/6379
- Please select the redis executable path [/usr/local/bin/redis-server]
编辑配置文件
vi /etc/redis/6379.conf
- daemonize yes
- port 6379
- timeout 300
- tcp-keepalive 60
启动
/etc/init.d/redis_6379 start
exists, process is already running or crashed
如报这个错,需要编辑下/etc/init.d/redis_6379,去除头上的\n
加入自动启动
chkconfig –add redis_6379
安装Elasticsearch
http://www.elasticsearch.org/
http://www.elasticsearch.cn
集群安装只要节点在同一网段下,设置一致的cluster.name,启动的Elasticsearch即可相互检测到对方,组成集群
- wget https://download.elasticsearch.org/elasticsearch/elasticsearch/elasticsearch-1.3.2.tar.gz
- tar zxvf elasticsearch-1.3.2.tar.gz
- mv elasticsearch-1.3.2 /usr/local/
- cd /usr/local/
- ln -s elasticsearch-1.3.2 elasticsearch
- elasticsearch/bin/elasticsearch -f
- [2014-08-20 13:19:05,710][INFO ][node ] [Jackpot] version[1.3.2], pid[19320], build[dee175d/2014-08-13T14:29:30Z]
- [2014-08-20 13:19:05,727][INFO ][node ] [Jackpot] initializing …
- [2014-08-20 13:19:05,735][INFO ][plugins ] [Jackpot] loaded [], sites []
- [2014-08-20 13:19:10,722][INFO ][node ] [Jackpot] initialized
- [2014-08-20 13:19:10,723][INFO ][node ] [Jackpot] starting …
- [2014-08-20 13:19:10,934][INFO ][transport ] [Jackpot] bound_address {inet[/0.0.0.0:9301]}, publish_address {inet[/61.x.x.x:9301]}
- [2014-08-20 13:19:10,958][INFO ][discovery ] [Jackpot] elasticsearch/5hUOX-2ES82s_0zvI9BUdg
- [2014-08-20 13:19:14,011][INFO ][cluster.service ] [Jackpot] new_master [Jackpot][5hUOX-2ES82s_0zvI9BUdg][Impala][inet[/61.x.x.x:9301]], reason: zen-disco-join (elected_as_master)
- [2014-08-20 13:19:14,060][INFO ][http ] [Jackpot] bound_address {inet[/0.0.0.0:9201]}, publish_address {inet[/61.x.x.x:9201]}
- [2014-08-20 13:19:14,061][INFO ][node ] [Jackpot] started
- [2014-08-20 13:19:14,106][INFO ][gateway ] [Jackpot] recovered [0] indices into cluster_state
- [2014-08-20 13:20:58,273][INFO ][node ] [Jackpot] stopping …
- [2014-08-20 13:20:58,323][INFO ][node ] [Jackpot] stopped
- [2014-08-20 13:20:58,323][INFO ][node ] [Jackpot] closing …
- [2014-08-20 13:20:58,332][INFO ][node ] [Jackpot] closed
ctrl+c退出
以后台方式运行
elasticsearch/bin/elasticsearch -d
访问默认的9200端口
curl -X GET http://localhost:9200
- {
- “status” : 200,
- “name” : “Steve Rogers”,
- “version” : {
- “number” : “1.3.2”,
- “build_hash” : “dee175dbe2f254f3f26992f5d7591939aaefd12f”,
- “build_timestamp” : “2014-08-13T14:29:30Z”,
- “build_snapshot” : false,
- “lucene_version” : “4.9”
- },
- “tagline” : “You Know, for Search”
- }
安装logstash
http://logstash.net/
- wget https://download.elasticsearch.org/logstash/logstash/logstash-1.4.2.tar.gz
- tar zxvf logstash-1.4.2.tar.gz
- mv logstash-1.4.2 /usr/local
- cd /usr/local
- ln -s logstash-1.4.2 logstash
- mkdir logstash/conf
- chown -R root:root logstash

因为java的默认heap size,回收机制等原因,logstash从1.4.0开始不再使用jar运行方式.
以前方式:
java -jar logstash-1.3.3-flatjar.jar agent -f logstash.conf
现在方式:
bin/logstash agent -f logstash.conf
logstash下载即可使用,命令行参数可以参考logstash flags,主要有
http://logstash.net/docs/1.2.1/flags
安装kibana
logstash的最新版已经内置kibana,你也可以单独部署kibana。kibana3是纯粹JavaScript+html的客户端,所以可以部署到任意http服务器上。
http://www.elasticsearch.org/overview/elkdownloads/
- wget https://download.elasticsearch.org/kibana/kibana/kibana-3.1.0.tar.gz
- tar zxvf kibana-3.1.0.tar.gz
- mv kibana-3.1.0 /opt/htdocs/www/kibana
- vi /opt/htdocs/www/kibana/config.js
配置elasticsearch源
elasticsearch: “http://”+window.location.hostname+”:9200″,
加入iptables
6379为redis端口,9200为elasticsearch端口,118.x.x.x/16为当前测试时的客户端ip
- iptables -A INPUT -p tcp -m tcp -s 118.x.x.x/16 –dport 9200 –j ACCEPT
测试运行前端输出
bin/logstash -e ‘input { stdin { } } output { stdout {} }’
输入hello测试
2014-08-20T05:17:02.876+0000 Impala hello
测试运行输出到后端
bin/logstash -e ‘input { stdin { } } output { elasticsearch { host => localhost } }’
访问kibana
http://adminimpala.campusapply.com/kibana/index.html#/dashboard/file/default.json
Yes- Great! We have a prebuilt dashboard: (Logstash Dashboard). See the note to the right about making it your global default
No results There were no results because no indices were found that match your selected time span
设置kibana读取源
在kibana的右上角有个 configure dashboard,再进入Index Settings
[logstash-]YYYY.MM.DD
这个需和logstash的输出保持一致
elasticsearch 跟 MySQL 中定义资料格式的角色关系对照表如下
MySQL elasticsearch
database index
table type
table schema mapping
row document
field field
ELK整合
syslog-ng.conf
- #省略其它内容
- # Remote logging syslog
- source s_remote {
- udp(ip(192.168.0.39) port(514));
- };
- #nginx log
- source s_remotetcp {
- tcp(ip(192.168.0.39) port(514) log_fetch_limit(100) log_iw_size(50000) max-connections(50) );
- };
- filter f_filter12 { program(‘c1gstudio\.com’); };
- #logstash syslog
- destination d_logstash_syslog { udp(“localhost” port(10999) localport(10998) ); };
- #logstash web
- destination d_logstash_web { tcp(“localhost” port(10997) localport(10996) ); };
- log { source(s_remote); destination(d_logstash_syslog); };
- log { source(s_remotetcp); filter(f_filter12); destination(d_logstash_web); };
logstash_syslog.conf
- input {
- udp {
- port => 10999
- type => syslog
- }
- }
- filter {
- if [type] == “syslog” {
- grok {
- match => { “message” => “%{SYSLOGTIMESTAMP:syslog_timestamp} %{SYSLOGHOST:syslog_hostname} %{DATA:syslog_program}(?:\[%{POSINT:syslog_pid}\])?: %{GREEDYDATA:syslog_message}” }
- add_field => [ “received_at”, “%{@timestamp}” ]
- add_field => [ “received_from”, “%{host}” ]
- }
- syslog_pri { }
- date {
- match => [ “syslog_timestamp”, “MMM d HH:mm:ss”, “MMM dd HH:mm:ss” ]
- }
- }
- }
- output {
- elasticsearch {
- host => localhost
- index => “syslog-%{+YYYY}”
- }
- }
logstash_redis.conf
- input {
- tcp {
- port => 10997
- type => web
- }
- }
- filter {
- grok {
- match => [ “message”, “%{SYSLOGTIMESTAMP:syslog_timestamp} (?:%{SYSLOGFACILITY:syslog_facility} )?%{SYSLOGHOST:syslog_source} %{PROG:syslog_program}(?:\[%{POSINT:syslog_pid}\])?: %{IPORHOST:clientip} – (?:%{USER:remote_user}|-) \[%{HTTPDATE:timestamp}\] \”%{WORD:method} %{URIPATHPARAM:request} HTTP/%{NUMBER:httpversion}\” %{NUMBER:status} (?:%{NUMBER:body_bytes_sent}|-) \”(?:%{URI:http_referer}|-)\” %{QS:agent} (?:%{IPV4:http_x_forwarded_for}|-)”]
- remove_field => [ ‘@version’,’host’,’syslog_timestamp’,’syslog_facility’,’syslog_pid’]
- }
- date {
- match => [ “timestamp” , “dd/MMM/yyyy:HH:mm:ss Z” ]
- }
- useragent {
- source => “agent”
- prefix => “useragent_”
- remove_field => [ “useragent_device”, “useragent_major”, “useragent_minor” ,”useragent_patch”,”useragent_os”,”useragent_os_major”,”useragent_os_minor”]
- }
- geoip {
- source => “clientip”
- fields => [“country_name”, “region_name”, “city_name”, “real_region_name”, “latitude”, “longitude”]
- remove_field => [ “[geoip][longitude]”, “[geoip][latitude]”,”location”,”region_name” ]
- }
- }
- output {
- #stdout { codec => rubydebug }
- redis {
- batch => true
- batch_events => 500
- batch_timeout => 5
- host => “127.0.0.1”
- data_type => “list”
- key => “logstash:web”
- workers => 2
- }
- }
logstash_web.conf
- input {
- redis {
- host => “127.0.0.1”
- port => “6379”
- key => “logstash:web”
- data_type => “list”
- codec => “json”
- type => “web”
- }
- }
- output {
- elasticsearch {
- flush_size => 5000
- host => localhost
- idle_flush_time => 10
- index => “web-%{+YYYY.MM.dd}”
- }
- #stdout { codec => rubydebug }
- }
启动elasticsearch和logstash
/usr/local/elasticsearch/bin/elasticsearch -d
/usr/local/logstash/bin/logstash agent -f /usr/local/logstash/conf/logstash_syslog.conf &
/usr/local/logstash/bin/logstash agent -f /usr/local/logstash/conf/logstash_redis.conf &
/usr/local/logstash/bin/logstash agent -f /usr/local/logstash/conf/logstash_web.conf &
关闭
ps aux|egrep ‘search|logstash’
kill pid
安装控制器elasticsearch-servicewrapper
如果是在服务器上就可以使用elasticsearch-servicewrapper这个es插件,它支持通过参数,指定是在后台或前台运行es,并且 支持启动,停止,重启es服务(默认es脚本只能通过ctrl+c关闭es)。使用方法是到https://github.com /elasticsearch/elasticsearch-servicewrapper下载service文件夹,放到es的bin目录下。下面是命 令集合:
bin/service/elasticsearch +
console 在前台运行es
start 在后台运行es
stop 停止es
install 使es作为服务在服务器启动时自动启动
remove 取消启动时自动启动
vi /usr/local/elasticsearch/service/elasticsearch.conf
set.default.ES_HOME=/usr/local/elasticsearch
命令示例
查看状态
http://61.x.x.x:9200/_status?pretty=true
集群健康查看
http://61.x.x.x:9200/_cat/health?v
epoch timestamp cluster status node.total node.data shards pri relo init unassign
1409021531 10:52:11 elasticsearch yellow 2 1 20 20 0 0 20
列出集群索引
http://61.x.x.x:9200/_cat/indices?v
health index pri rep docs.count docs.deleted store.size pri.store.size
yellow web-2014.08.25 5 1 5990946 0 3.6gb 3.6gb
yellow kibana-int 5 1 2 0 20.7kb 20.7kb
yellow syslog-2014 5 1 709 0 585.6kb 585.6kb
yellow web-2014.08.26 5 1 1060326 0 712mb 712mb
删除索引
curl -XDELETE ‘http://localhost:9200/kibana-int/’
curl -XDELETE ‘http://localhost:9200/logstash-2014.08.*’
优化索引
$ curl -XPOST ‘http://localhost:9200/old-index-name/_optimize’
查看日志
tail /usr/local/elasticsearch/logs/elasticsearch.log
- 2.4mb]->[2.4mb]/[273mb]}{[survivor] [3.6mb]->[34.1mb]/[34.1mb]}{[old] [79.7mb]->[80mb]/[682.6mb]}
- [2014-08-26 10:37:14,953][WARN ][monitor.jvm ] [Red Shift] [gc][young][71044][54078] duration [43s], collections [1]/[46.1s], total [43s]/[26.5m], memory [384.7mb]->[123mb]/[989.8mb], all_pools {[young] [270.5mb]->[1.3mb]/[273mb]}{[survivor] [34.1mb]->[22.3mb]/[34.1mb]}{[old] [80mb]->[99.4mb]/[682.6mb]}
- [2014-08-26 10:38:03,619][WARN ][monitor.jvm ] [Red Shift] [gc][young][71082][54080] duration [6.6s], collections [1]/[9.1s], total [6.6s]/[26.6m], memory [345.4mb]->[142.1mb]/[989.8mb], all_pools {[young] [224.2mb]->[2.8mb]/[273mb]}{[survivor] [21.8mb]->[34.1mb]/[34.1mb]}{[old] [99.4mb]->[105.1mb]/[682.6mb]}
- [2014-08-26 10:38:10,109][INFO ][cluster.service ] [Red Shift] removed {[logstash-Impala-26670-2010][av8JOuEoR_iK7ZO0UaltqQ][Impala][inet[/61.x.x.x:9302]]{client=true, data=false},}, reason: zen-disco-node_failed([logstash-Impala-26670-2010][av8JOuEoR_iK7ZO0UaltqQ][Impala][inet[/61.x.x.x:9302]]{client=true, data=false}), reason transport disconnected (with verified connect)
- [2014-08-26 10:39:37,899][WARN ][monitor.jvm ] [Red Shift] [gc][young][71171][54081] duration [3.4s], collections [1]/[4s], total [3.4s]/[26.6m], memory [411.7mb]->[139.5mb]/[989.8mb], all_pools {[young] [272.4mb]->[1.5mb]/[273mb]}{[survivor] [34.1mb]->[29.1mb]/[34.1mb]}{[old] [105.1mb]->[109mb]/[682.6mb]}
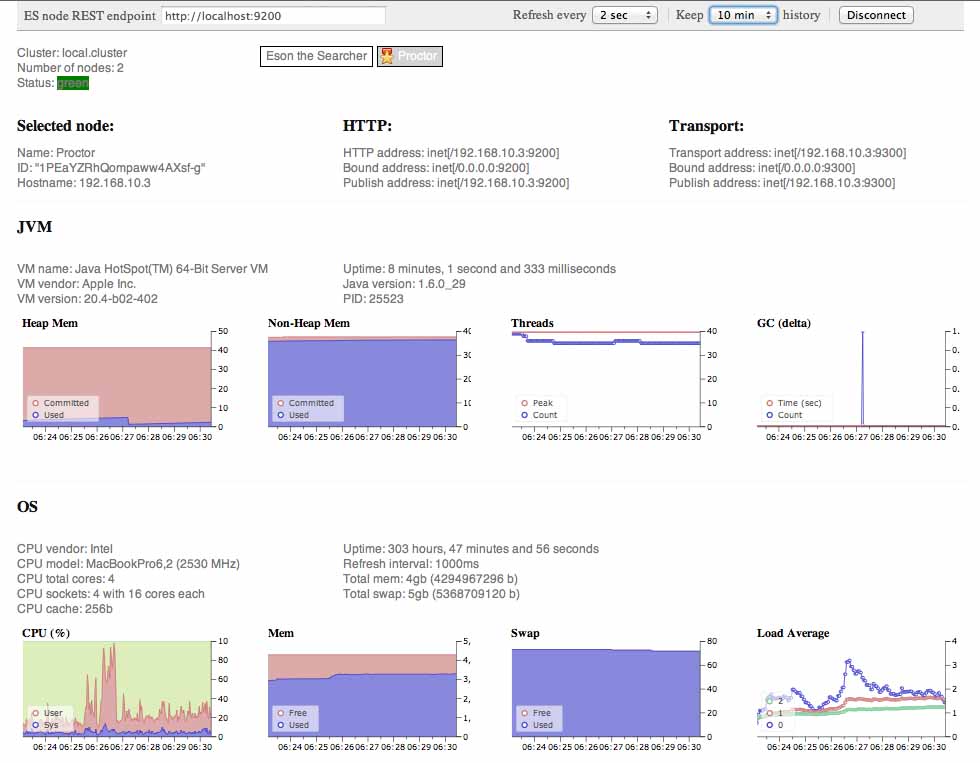
安装bigdesk
要想知道整个插件的列表,请访问http://www.elasticsearch.org/guide/reference/modules /plugins/ 插件还是很多的,个人认为比较值得关注的有以下几个,其他的看你需求,比如你要导入数据当然就得关注river了。
该插件可以查看集群的jvm信息,磁盘IO,索引创建删除信息等,适合查找系统瓶颈,监控集群状态等,可以执行如下命令进行安装,或者访问项目地址:https://github.com/lukas-vlcek/bigdesk
bin/plugin -install lukas-vlcek/bigdesk
- Downloading ……………………………………………………………………………………………………………………………………………………………………………………………………………………………DONE
- Installed lukas-vlcek/bigdesk into /usr/local/elasticsearch/plugins/bigdesk
- Identified as a _site plugin, moving to _site structure …
cp -ar plugins/bigdesk/_site/ /opt/htdocs/www/bigdesk
访问
http://localhost/bigdesk
安全优化
1.安全漏洞,影响ElasticSearch 1.2及以下版本 http://bouk.co/blog/elasticsearch-rce/
/usr/local/elasticsearch/config/elasticsearch.yml
script.disable_dynamic: true
2.如果有多台机器,可以以每台设置n个shards的方式,根据业务情况,可以考虑取消replias
这里设置默认的5个shards, 复制为0,shards定义后不能修改,replicas可以动态修改
/usr/local/elasticsearch/config/elasticsearch.yml
index.number_of_shards: 5
index.number_of_replicas: 0
#定义数据目录(可选)
path.data: /opt/elasticsearch
3.内存适当调大,初始是-Xms256M, 最大-Xmx1G,-Xss256k,
调大后,最小和最大一样,避免GC, 并根据机器情况,设置内存大小,
vi /usr/local/elasticsearch/bin/elasticsearch.in.sh
if [ “x$ES_MIN_MEM” = “x” ]; then
#ES_MIN_MEM=256m
ES_MIN_MEM=2g
fi
if [ “x$ES_MAX_MEM” = “x” ]; then
#ES_MAX_MEM=1g
ES_MAX_MEM=2g
fi
4.减少shard刷新间隔
curl -XPUT ‘http://61.x.x.x:9200/dw-search/_settings’ -d ‘{
“index” : {
“refresh_interval” : “-1”
}
}’
完成bulk插入后再修改为初始值
curl -XPUT ‘http://61.x.x.x:9200/dw-search/_settings’ -d ‘{
“index” : {
“refresh_interval” : “1s”
}
}’
/etc/elasticsearch/elasticsearch.yml
tranlog数据达到多少条进行平衡,默认为5000,刷新频率,默认为120s
index.translog.flush_threshold_ops: “100000”
index.refresh_interval: 60s
5.关闭文件的更新时间
/etc/fstab
在文件中添加 noatime,nodiratime
/dev/sdc1 /data1 ext4 noatime,nodiratime 0 0
自启动
chkconfig add redis_6379
vi /etc/rc.local
/usr/local/elasticsearch/bin/elasticsearch -d
/usr/local/logstash/bin/logstash agent -f /usr/local/logstash/conf/logstash_syslog.conf &
/usr/local/logstash/bin/logstash agent -f /usr/local/logstash/conf/logstash_redis.conf &
/usr/local/logstash/bin/logstash agent -f /usr/local/logstash/conf/logstash_web.conf &
/opt/lemp startnginx
安装问题
==========================================
LoadError: Could not load FFI Provider: (NotImplementedError) FFI not available: null
See http://jira.codehaus.org/browse/JRUBY-4583
一开始我以为是没有FFI,把jruby,ruby gem都装了一遍.
实际是由于我的/tmp没有运行权限造成的,建个tmp目录就可以了,附上ruby安装步骤.
mkdir /usr/local/jdk/tmp
vi /usr/local/logstash/bin/logstash.lib.sh
JAVA_OPTS=”$JAVA_OPTS -Djava.io.tmpdir=/usr/local/jdk/tmp”
===============================
jruby 安装
- wget http://jruby.org.s3.amazonaws.com/downloads/1.7.13/jruby-bin-1.7.13.tar.gz
- mv jruby-1.7.13 /usr/local/
- cd /usr/local/
- ln -s jruby-1.7.13 jruby
Ruby Gem 安装
Ruby 1.9.2版本默认已安装Ruby Gem
安装gem 需要ruby的版本在 1.8.7 以上,默认的centos5 上都是1.8.5 版本,所以首先你的升级你的ruby ,
ruby -v
ruby 1.8.5 (2006-08-25) [x86_64-linux]
- wget http://cache.ruby-lang.org/pub/ruby/1.9/ruby-1.9.3-p547.tar.gz
- tar zxvf ruby-1.9.3-p547.tar.gz
- cd ruby-1.9.3-p547
- ./configure –prefix=/usr/local/ruby-1.9.3-p547
- make && make install
- cd /usr/local
- ln -s ruby-1.9.3-p547 ruby
vi /etc/profile
export PATH=$JAVA_HOME/bin:/usr/local/ruby/bin:$PATH
source /etc/profile
gem install bundler
gem install i18n
gem install ffi
=======================
elasticsearch 端口安全
绑定内网ip
iptables 只开放内网
前端机反向代理
server
{
listen 9201;
server_name big.c1gstudio.com;
index index.html index.htm index.php;
root /opt/htdocs/www;
include manageip.conf;
deny all;
location / {
proxy_pass http://192.168.0.39:9200;
proxy_set_header Host $host;
proxy_set_header X-Real-IP $remote_addr;
proxy_set_header X-Forwarded-For $proxy_add_x_forwarded_for;
#proxy_set_header X-Forwarded-For $remote_addr;
add_header X-Cache Cache-156;
proxy_redirect off;
}
access_log /opt/nginx/logs/access.log access;
}
kibana的config.js
elasticsearch: “http://”+window.location.hostname+”:9201″,