logstash + elasticsearch + Kibana + Redis + Syslog-ng
ElasticSearch is an open-source, distributed, RESTful search engine built on Lucene. Designed for cloud computing, it enables real-time search with stability, reliability, speed, and ease of installation. It supports data indexing via HTTP using JSON.
Logstash is a platform for transporting, processing, managing, and searching application logs and events. You can use it to centrally collect and manage application logs, providing a Web interface for querying and statistics. Note that Logstash can be replaced by other tools, such as Fluentd.
Kibana is a web interface for log analysis provided for Logstash and ElasticSearch. It allows you to perform efficient searches, visualizations, analyses, and other operations on your logs.
Redis is a high-performance in-memory key-value database. It is optional but helps prevent data loss.

References:
http://www.logstash.net/
http://chenlinux.com/2012/10/21/elasticearch-simple-usage/
http://www.elasticsearch.cn
http://download.oracle.com/otn-pub/java/jdk/7u67-b01/jdk-7u67-linux-x64.tar.gz?AuthParam=1408083909_3bf5b46169faab84d36cf74407132bba
http://curran.blog.51cto.com/2788306/1263416
http://storysky.blog.51cto.com/628458/1158707/
http://zhumeng8337797.blog.163.com/blog/static/10076891420142712316899/
http://enable.blog.51cto.com/747951/1049411
http://chenlinux.com/2014/06/11/nginx-access-log-to-elasticsearch/
http://www.w3c.com.cn/%E5%BC%80%E6%BA%90%E5%88%86%E5%B8%83%E5%BC%8F%E6%90%9C%E7%B4%A2%E5%B9%B3%E5%8F%B0elkelasticsearchlogstashkibana%E5%85%A5%E9%97%A8%E5%AD%A6%E4%B9%A0%E8%B5%84%E6%BA%90%E7%B4%A2%E5%BC%95
http://woodygsd.blogspot.com/2014/06/an-adventure-with-elk-or-how-to-replace.html
http://www.ricardomartins.com.br/enviando-dados-externos-para-a-stack-elk/
http://tinytub.github.io/logstash-install.html
http://jamesmcfadden.co.uk/securing-elasticsearch-with-nginx/
https://github.com/elasticsearch/logstash/blob/master/patterns/grok-patterns
http://zhaoyanblog.com/archives/319.html
http://www.vpsee.com/2014/05/install-and-play-with-elasticsearch/
IP Explanation
118.x.x.x/16 represents the client IP.
192.168.0.39 and 61.x.x.x represent the internal and external IPs of the ELK stack, respectively.
Installing JDK
http://www.oracle.com/technetwork/java/javase/downloads/jdk7-downloads-1880260.html
- tar zxvf jdk-7u67-linux-x64.tar.gz?AuthParam=1408083909_3bf5b46169faab84d36cf74407132b
- mv jdk1.7.0_67 /usr/local/
- cd /usr/local/
- ln -s jdk1.7.0_67 jdk
- chown -R root:root jdk/
Configure Environment Variables
vi /etc/profile
- export JAVA_HOME=/usr/local/jdk
- export JRE_HOME=$JAVA_HOME/jre
- export CLASSPATH=.:$JAVA_HOME/lib/dt.jar:$JAVA_HOME/lib/tools.jar:$JRE_HOME/lib:$CLASSPATH
- export PATH=$JAVA_HOME/bin:$PATH
- export REDIS_HOME=/usr/local/redis
- export ES_HOME=/usr/local/elasticsearch
- export ES_CLASSPATH=$ES_HOME/config
Apply Variables
source /etc/profile
Verify Version
java -version
- java version “1.7.0_67”
- Java(TM) SE Runtime Environment (build 1.7.0_67-b01)
- Java HotSpot(TM) 64-Bit Server VM (build 24.65-b04, mixed mode)
If Java was previously installed, uninstall it first.
rpm -qa |grep java
java-1.6.0-openjdk-1.6.0.0-1.24.1.10.4.el5
java-1.6.0-openjdk-devel-1.6.0.0-1.24.1.10.4.el5
rpm -e java-1.6.0-openjdk-1.6.0.0-1.24.1.10.4.el5 java-1.6.0-openjdk-devel-1.6.0.0-1.24.1.10.4.el5
Installing Redis
http://redis.io/
- wget http://download.redis.io/releases/redis-2.6.17.tar.gz
- tar zxvf redis-2.6.17.tar.gz
- mv redis-2.6.17 /usr/local/
- cd /usr/local
- ln -s redis-2.6.17 redis
- cd /usr/local/redis
- make
- make install
cd utils
./install_server.sh
- Please select the redis port for this instance: [6379]
- Selecting default: 6379
- Please select the redis config file name [/etc/redis/6379.conf]
- Selected default – /etc/redis/6379.conf
- Please select the redis log file name [/var/log/redis_6379.log]
- Selected default – /var/log/redis_6379.log
- Please select the data directory for this instance [/var/lib/redis/6379]
- Selected default – /var/lib/redis/6379
- Please select the redis executable path [/usr/local/bin/redis-server]
Edit Configuration File
vi /etc/redis/6379.conf
- daemonize yes
- port 6379
- timeout 300
- tcp-keepalive 60
Start Service
/etc/init.d/redis_6379 start
exists, process is already running or crashed
If you encounter this error, edit /etc/init.d/redis_6379 and remove the leading n characters.
Add to Auto-start
chkconfig –add redis_6379
Installing Elasticsearch
http://www.elasticsearch.org/
http://www.elasticsearch.cn
For cluster installation, as long as nodes are in the same subnet and have the same cluster.name set, the started Elasticsearch instances will detect each other and form a cluster.
- wget https://download.elasticsearch.org/elasticsearch/elasticsearch/elasticsearch-1.3.2.tar.gz
- tar zxvf elasticsearch-1.3.2.tar.gz
- mv elasticsearch-1.3.2 /usr/local/
- cd /usr/local/
- ln -s elasticsearch-1.3.2 elasticsearch
- elasticsearch/bin/elasticsearch -f
- [2014-08-20 13:19:05,710][INFO ][node ] [Jackpot] version[1.3.2], pid[19320], build[dee175d/2014-08-13T14:29:30Z]
- [2014-08-20 13:19:05,727][INFO ][node ] [Jackpot] initializing …
- [2014-08-20 13:19:05,735][INFO ][plugins ] [Jackpot] loaded [], sites []
- [2014-08-20 13:19:10,722][INFO ][node ] [Jackpot] initialized
- [2014-08-20 13:19:10,723][INFO ][node ] [Jackpot] starting …
- [2014-08-20 13:19:10,934][INFO ][transport ] [Jackpot] bound_address {inet[/0.0.0.0:9301]}, publish_address {inet[/61.x.x.x:9301]}
- [2014-08-20 13:19:10,958][INFO ][discovery ] [Jackpot] elasticsearch/5hUOX-2ES82s_0zvI9BUdg
- [2014-08-20 13:19:14,011][INFO ][cluster.service ] [Jackpot] new_master [Jackpot][5hUOX-2ES82s_0zvI9BUdg][Impala][inet[/61.x.x.x:9301]], reason: zen-disco-join (elected_as_master)
- [2014-08-20 13:19:14,060][INFO ][http ] [Jackpot] bound_address {inet[/0.0.0.0:9201]}, publish_address {inet[/61.x.x.x:9201]}
- [2014-08-20 13:19:14,061][INFO ][node ] [Jackpot] started
- [2014-08-20 13:19:14,106][INFO ][gateway ] [Jackpot] recovered [0] indices into cluster_state
- [2014-08-20 13:20:58,273][INFO ][node ] [Jackpot] stopping …
- [2014-08-20 13:20:58,323][INFO ][node ] [Jackpot] stopped
- [2014-08-20 13:20:58,323][INFO ][node ] [Jackpot] closing …
- [2014-08-20 13:20:58,332][INFO ][node ] [Jackpot] closed
Press Ctrl+C to exit.
Run in Background
elasticsearch/bin/elasticsearch -d
Access Default Port 9200
curl -X GET http://localhost:9200
- {
- “status” : 200,
- “name” : “Steve Rogers”,
- “version” : {
- “number” : “1.3.2”,
- “build_hash” : “dee175dbe2f254f3f26992f5d7591939aaefd12f”,
- “build_timestamp” : “2014-08-13T14:29:30Z”,
- “build_snapshot” : false,
- “lucene_version” : “4.9”
- },
- “tagline” : “You Know, for Search”
- }
Installing Logstash
http://logstash.net/
- wget https://download.elasticsearch.org/logstash/logstash/logstash-1.4.2.tar.gz
- tar zxvf logstash-1.4.2.tar.gz
- mv logstash-1.4.2 /usr/local
- cd /usr/local
- ln -s logstash-1.4.2 logstash
- mkdir logstash/conf
- chown -R root:root logstash

Due to Java’s default heap size and garbage collection mechanisms, Logstash no longer uses the jar execution method starting from version 1.4.0.
Previous method:
java -jar logstash-1.3.3-flatjar.jar agent -f logstash.conf
Current method:
bin/logstash agent -f logstash.conf
Logstash can be used immediately after download. Command-line arguments can be found at logstash flags:
http://logstash.net/docs/1.2.1/flags
Installing Kibana
The latest version of Logstash includes Kibana, but you can also deploy Kibana separately. Kibana 3 is a pure JavaScript + HTML client, so it can be deployed on any HTTP server.
http://www.elasticsearch.org/overview/elkdownloads/
- wget https://download.elasticsearch.org/kibana/kibana/kibana-3.1.0.tar.gz
- tar zxvf kibana-3.1.0.tar.gz
- mv kibana-3.1.0 /opt/htdocs/www/kibana
- vi /opt/htdocs/www/kibana/config.js
Configure Elasticsearch source:
elasticsearch: “http://”+window.location.hostname+”:9200″,
Add to iptables
6379 is the Redis port, 9200 is the Elasticsearch port, and 118.x.x.x/16 is the client IP during testing.
- iptables -A INPUT -p tcp -m tcp -s 118.x.x.x/16 –dport 9200 –j ACCEPT
Test Frontend Output
bin/logstash -e ‘input { stdin { } } output { stdout {} }’
Test Input ‘hello’
2014-08-20T05:17:02.876+0000 Impala hello
Test Backend Output
bin/logstash -e ‘input { stdin { } } output { elasticsearch { host => localhost } }’
Access Kibana
http://adminimpala.campusapply.com/kibana/index.html#/dashboard/file/default.json
Yes- Great! We have a prebuilt dashboard: (Logstash Dashboard). See the note to the right about making it your global default.
No results There were no results because no indices were found that match your selected time span.
Configure Kibana Data Source
In the top-right corner of Kibana, click “configure dashboard,” then go to Index Settings.
[logstash-]YYYY.MM.DD
This must match the output format of Logstash.
Elasticsearch vs MySQL Schema Mapping
MySQL elasticsearch
database index
table type
table schema mapping
row document
field field
ELK Integration
syslog-ng.conf
- # Omit other content
- # Remote logging syslog
- source s_remote {
- udp(ip(192.168.0.39) port(514));
- };
- # nginx log
- source s_remotetcp {
- tcp(ip(192.168.0.39) port(514) log_fetch_limit(100) log_iw_size(50000) max-connections(50) );
- };
- filter f_filter12 { program(‘c1gstudio.com’); };
- # logstash syslog
- destination d_logstash_syslog { udp(“localhost” port(10999) localport(10998) ); };
- # logstash web
- destination d_logstash_web { tcp(“localhost” port(10997) localport(10996) ); };
- log { source(s_remote); destination(d_logstash_syslog); };
- log { source(s_remotetcp); filter(f_filter12); destination(d_logstash_web); };
logstash_syslog.conf
- input {
- udp {
- port => 10999
- type => syslog
- }
- }
- filter {
- if [type] == “syslog” {
- grok {
- match => { “message” => “%{SYSLOGTIMESTAMP:syslog_timestamp} %{SYSLOGHOST:syslog_hostname} %{DATA:syslog_program}(?:[%{POSINT:syslog_pid}])?: %{GREEDYDATA:syslog_message}” }
- add_field => [ “received_at”, “%{@timestamp}” ]
- add_field => [ “received_from”, “%{host}” ]
- }
- syslog_pri { }
- date {
- match => [ “syslog_timestamp”, “MMM d HH:mm:ss”, “MMM dd HH:mm:ss” ]
- }
- }
- }
- output {
- elasticsearch {
- host => localhost
- index => “syslog-%{+YYYY}”
- }
- }
logstash_redis.conf
- input {
- tcp {
- port => 10997
- type => web
- }
- }
- filter {
- grok {
- match => [ “message”, “%{SYSLOGTIMESTAMP:syslog_timestamp} (?:%{SYSLOGFACILITY:syslog_facility} )?%{SYSLOGHOST:syslog_source} %{PROG:syslog_program}(?:[%{POSINT:syslog_pid}])?: %{IPORHOST:clientip} – (?:%{USER:remote_user}|-) [%{HTTPDATE:timestamp}] “%{WORD:method} %{URIPATHPARAM:request} HTTP/%{NUMBER:httpversion}” %{NUMBER:status} (?:%{NUMBER:body_bytes_sent}|-) “(?:%{URI:http_referer}|-)” %{QS:agent} (?:%{IPV4:http_x_forwarded_for}|-)”]
- remove_field => [ ‘@version’,’host’,’syslog_timestamp’,’syslog_facility’,’syslog_pid’]
- }
- date {
- match => [ “timestamp” , “dd/MMM/yyyy:HH:mm:ss Z” ]
- }
- useragent {
- source => “agent”
- prefix => “useragent_”
- remove_field => [ “useragent_device”, “useragent_major”, “useragent_minor” ,”useragent_patch”,”useragent_os”,”useragent_os_major”,”useragent_os_minor”]
- }
- geoip {
- source => “clientip”
- fields => [“country_name”, “region_name”, “city_name”, “real_region_name”, “latitude”, “longitude”]
- remove_field => [ “[geoip][longitude]”, “[geoip][latitude]”,”location”,”region_name” ]
- }
- }
- output {
- #stdout { codec => rubydebug }
- redis {
- batch => true
- batch_events => 500
- batch_timeout => 5
- host => “127.0.0.1”
- data_type => “list”
- key => “logstash:web”
- workers => 2
- }
- }
logstash_web.conf
- input {
- redis {
- host => “127.0.0.1”
- port => “6379”
- key => “logstash:web”
- data_type => “list”
- codec => “json”
- type => “web”
- }
- }
- output {
- elasticsearch {
- flush_size => 5000
- host => localhost
- idle_flush_time => 10
- index => “web-%{+YYYY.MM.dd}”
- }
- #stdout { codec => rubydebug }
- }
Start Elasticsearch and Logstash
/usr/local/elasticsearch/bin/elasticsearch -d
/usr/local/logstash/bin/logstash agent -f /usr/local/logstash/conf/logstash_syslog.conf &
/usr/local/logstash/bin/logstash agent -f /usr/local/logstash/conf/logstash_redis.conf &
/usr/local/logstash/bin/logstash agent -f /usr/local/logstash/conf/logstash_web.conf &
Stop Services
ps aux|egrep ‘search|logstash’
kill pid
Install Controller: elasticsearch-servicewrapper
If running on a server, you can use the elasticsearch-servicewrapper plugin. It supports specifying whether to run ES in the background or foreground via parameters, and supports starting, stopping, and restarting the ES service (by default, ES scripts can only be stopped via Ctrl+C). To use it, download the service folder from https://github.com/elasticsearch/elasticsearch-servicewrapper and place it in the ES bin directory. Below are the commands:
bin/service/elasticsearch +
console Run ES in the foreground
start Run ES in the background
stop Stop ES
install Make ES auto-start on server boot
remove Disable auto-start on boot
vi /usr/local/elasticsearch/service/elasticsearch.conf
set.default.ES_HOME=/usr/local/elasticsearch
Command Examples
Check Status
http://61.x.x.x:9200/_status?pretty=true
Check Cluster Health
http://61.x.x.x:9200/_cat/health?v
epoch timestamp cluster status node.total node.data shards pri relo init unassign
1409021531 10:52:11 elasticsearch yellow 2 1 20 20 0 0 20
List Cluster Indices
http://61.x.x.x:9200/_cat/indices?v
health index pri rep docs.count docs.deleted store.size pri.store.size
yellow web-2014.08.25 5 1 5990946 0 3.6gb 3.6gb
yellow kibana-int 5 1 2 0 20.7kb 20.7kb
yellow syslog-2014 5 1 709 0 585.6kb 585.6kb
yellow web-2014.08.26 5 1 1060326 0 712mb 712mb
Delete Index
curl -XDELETE ‘http://localhost:9200/kibana-int/’
curl -XDELETE ‘http://localhost:9200/logstash-2014.08.*’
Optimize Index
$ curl -XPOST ‘http://localhost:9200/old-index-name/_optimize’
View Logs
tail /usr/local/elasticsearch/logs/elasticsearch.log
- 2.4mb]->[2.4mb]/[273mb]}{[survivor] [3.6mb]->[34.1mb]/[34.1mb]}{[old] [79.7mb]->[80mb]/[682.6mb]}
- [2014-08-26 10:37:14,953][WARN ][monitor.jvm ] [Red Shift] [gc][young][71044][54078] duration [43s], collections [1]/[46.1s], total [43s]/[26.5m], memory [384.7mb]->[123mb]/[989.8mb], all_pools {[young] [270.5mb]->[1.3mb]/[273mb]}{[survivor] [34.1mb]->[22.3mb]/[34.1mb]}{[old] [80mb]->[99.4mb]/[682.6mb]}
- [2014-08-26 10:38:03,619][WARN ][monitor.jvm ] [Red Shift] [gc][young][71082][54080] duration [6.6s], collections [1]/[9.1s], total [6.6s]/[26.6m], memory [345.4mb]->[142.1mb]/[989.8mb], all_pools {[young] [224.2mb]->[2.8mb]/[273mb]}{[survivor] [21.8mb]->[34.1mb]/[34.1mb]}{[old] [99.4mb]->[105.1mb]/[682.6mb]}
- [2014-08-26 10:38:10,109][INFO ][cluster.service ] [Red Shift] removed {[logstash-Impala-26670-2010][av8JOuEoR_iK7ZO0UaltqQ][Impala][inet[/61.x.x.x:9302]]{client=true, data=false},}, reason: zen-disco-node_failed([logstash-Impala-26670-2010][av8JOuEoR_iK7ZO0UaltqQ][Impala][inet[/61.x.x.x:9302]]{client=true, data=false}), reason transport disconnected (with verified connect)
- [2014-08-26 10:39:37,899][WARN ][monitor.jvm ] [Red Shift] [gc][young][71171][54081] duration [3.4s], collections [1]/[4s], total [3.4s]/[26.6m], memory [411.7mb]->[139.5mb]/[989.8mb], all_pools {[young] [272.4mb]->[1.5mb]/[273mb]}{[survivor] [34.1mb]->[29.1mb]/[34.1mb]}{[old] [105.1mb]->[109mb]/[682.6mb]}
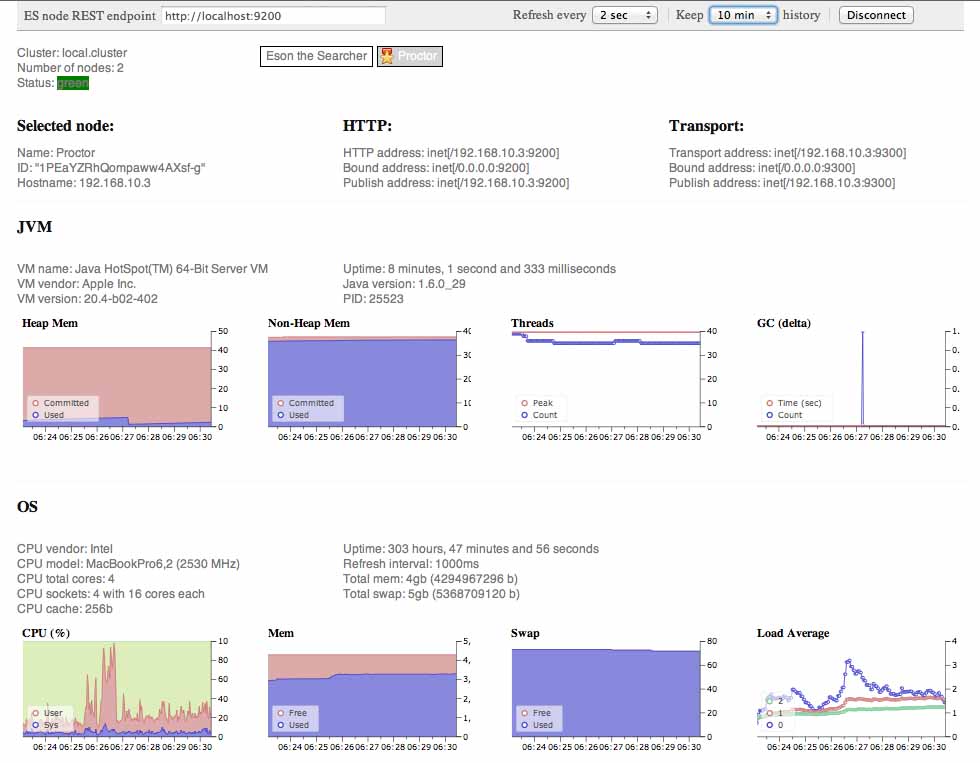
Install Bigdesk
To see the full list of plugins, visit http://www.elasticsearch.org/guide/reference/modules/plugins/. There are many plugins, but some are particularly noteworthy. For example, if you need to import data, you should look into rivers.
This plugin allows you to view JVM information, disk I/O, index creation/deletion info, etc., which is suitable for finding system bottlenecks and monitoring cluster status. Install it using the following command, or visit the project page: https://github.com/lukas-vlcek/bigdesk
bin/plugin -install lukas-vlcek/bigdesk
- Downloading ……………………………………………………………………………………………………………………………………………………………………………………………………………………………DONE
- Installed lukas-vlcek/bigdesk into /usr/local/elasticsearch/plugins/bigdesk
- Identified as a _site plugin, moving to _site structure …
cp -ar plugins/bigdesk/_site/ /opt/htdocs/www/bigdesk
Access
http://localhost/bigdesk
Security Optimization
1. Security Vulnerability affecting Elasticsearch 1.2 and below: http://bouk.co/blog/elasticsearch-rce/
/usr/local/elasticsearch/config/elasticsearch.yml
script.disable_dynamic: true
2. If you have multiple machines, you can set n shards per machine. Depending on business needs, consider disabling replicas.
Here we set the default to 5 shards and 0 replicas. Shards cannot be modified after definition, but replicas can be changed dynamically.
/usr/local/elasticsearch/config/elasticsearch.yml
index.number_of_shards: 5
index.number_of_replicas: 0
# Define data directory (optional)
path.data: /opt/elasticsearch
3. Increase memory appropriately. The initial settings are -Xms256M and -Xmx1G, with -Xss256k.
After increasing, set minimum and maximum memory to the same value to avoid GC issues. Adjust based on machine capacity.
vi /usr/local/elasticsearch/bin/elasticsearch.in.sh
if [ “x$ES_MIN_MEM” = “x” ]; then
#ES_MIN_MEM=256m
ES_MIN_MEM=2g
fi
if [ “x$ES_MAX_MEM” = “x” ]; then
#ES_MAX_MEM=1g
ES_MAX_MEM=2g
fi
4. Reduce shard refresh interval
curl -XPUT ‘http://61.x.x.x:9200/dw-search/_settings’ -d ‘{
“index” : {
“refresh_interval” : “-1”
}
}’
After completing bulk inserts, change it back to the initial value:
curl -XPUT ‘http://61.x.x.x:9200/dw-search/_settings’ -d ‘{
“index” : {
“refresh_interval” : “1s”
}
}’
/etc/elasticsearch/elasticsearch.yml
Balance transaction logs when they reach a certain count. Default is 5000, refresh frequency is 120s.
index.translog.flush_threshold_ops: “100000”
index.refresh_interval: 60s
5. Disable file access time updates
/etc/fstab
Add noatime,nodiratime to the file:
/dev/sdc1 /data1 ext4 noatime,nodiratime 0 0
Auto-start
chkconfig add redis_6379
vi /etc/rc.local
/usr/local/elasticsearch/bin/elasticsearch -d
/usr/local/logstash/bin/logstash agent -f /usr/local/logstash/conf/logstash_syslog.conf &
/usr/local/logstash/bin/logstash agent -f /usr/local/logstash/conf/logstash_redis.conf &
/usr/local/logstash/bin/logstash agent -f /usr/local/logstash/conf/logstash_web.conf &
/opt/lemp startnginx
Installation Issues
==========================================
LoadError: Could not load FFI Provider: (NotImplementedError) FFI not available: null
See http://jira.codehaus.org/browse/JRUBY-4583
Initially, I thought FFI was missing and installed jruby and ruby gems. However, the actual issue was that my /tmp directory lacked execute permissions. Creating a tmp directory resolved the issue. Below are the Ruby installation steps.
mkdir /usr/local/jdk/tmp
vi /usr/local/logstash/bin/logstash.lib.sh
JAVA_OPTS=”$JAVA_OPTS -Djava.io.tmpdir=/usr/local/jdk/tmp”
===============================
jruby Installation
- wget http://jruby.org.s3.amazonaws.com/downloads/1.7.13/jruby-bin-1.7.13.tar.gz
- mv jruby-1.7.13 /usr/local/
- cd /usr/local/
- ln -s jruby-1.7.13 jruby
Ruby Gem Installation
Ruby 1.9.2 comes with Ruby Gem pre-installed.
To install gem, Ruby version must be 1.8.7 or higher. CentOS 5 defaults to 1.8.5, so you must upgrade Ruby first.
ruby -v
ruby 1.8.5 (2006-08-25) [x86_64-linux]
- wget http://cache.ruby-lang.org/pub/ruby/1.9/ruby-1.9.3-p547.tar.gz
- tar zxvf ruby-1.9.3-p547.tar.gz
- cd ruby-1.9.3-p547
- ./configure –prefix=/usr/local/ruby-1.9.3-p547
- make && make install
- cd /usr/local
- ln -s ruby-1.9.3-p547 ruby
vi /etc/profile
export PATH=$JAVA_HOME/bin:/usr/local/ruby/bin:$PATH
source /etc/profile
gem install bundler
gem install i18n
gem install ffi
=======================
Elasticsearch Port Security
Bind to internal IP.
Use iptables to allow only internal network access.
Front-end Reverse Proxy
server
{
listen 9201;
server_name big.c1gstudio.com;
index index.html index.htm index.php;
root /opt/htdocs/www;
include manageip.conf;
deny all;
location / {
proxy_pass http://192.168.0.39:9200;
proxy_set_header Host $host;
proxy_set_header X-Real-IP $remote_addr;
proxy_set_header X-Forwarded-For $proxy_add_x_forwarded_for;
#proxy_set_header X-Forwarded-For $remote_addr;
add_header X-Cache Cache-156;
proxy_redirect off;
}
access_log /opt/nginx/logs/access.log access;
}
Kibana config.js
elasticsearch: “http://”+window.location.hostname+”:9201”,