Over time, the term “big data analytics” has gradually evolved from a concept into practical application. In recent years, more and more enterprises are no longer satisfied with periodic batch analysis tasks. To better utilize continuously generated business data and make faster, more effective business decisions, real-time data analytics has become a standard requirement for e-commerce, websites, and trading platforms.
On the other hand, building a self-managed real-time analytics platform requires significant cost and technical expertise. Many technical personnel prefer to mine data using SQL rather than code. Based on this, AWS’s Kinesis Analytics service effectively meets user needs. Through simple SQL statements and built-in rich functions, users can quickly build real-time analytics solutions tailored to their business scenarios. All underlying infrastructure is maintained by AWS, ensuring high service availability. Users can focus more energy on how to mine and analyze data.
This article starts from a practical application scenario to introduce how to use AWS services to analyze CloudFront access logs in real-time. Additionally, by leveraging DynamoDB’s Global Tables feature, users can analyze logs in regions that support Kinesis Analytics and synchronize the analysis results back to DynamoDB tables in their current region. This helps users in regions that do not yet support Kinesis Analytics to also use and enjoy the convenience brought by this service.
Let’s look at the solution architecture below:
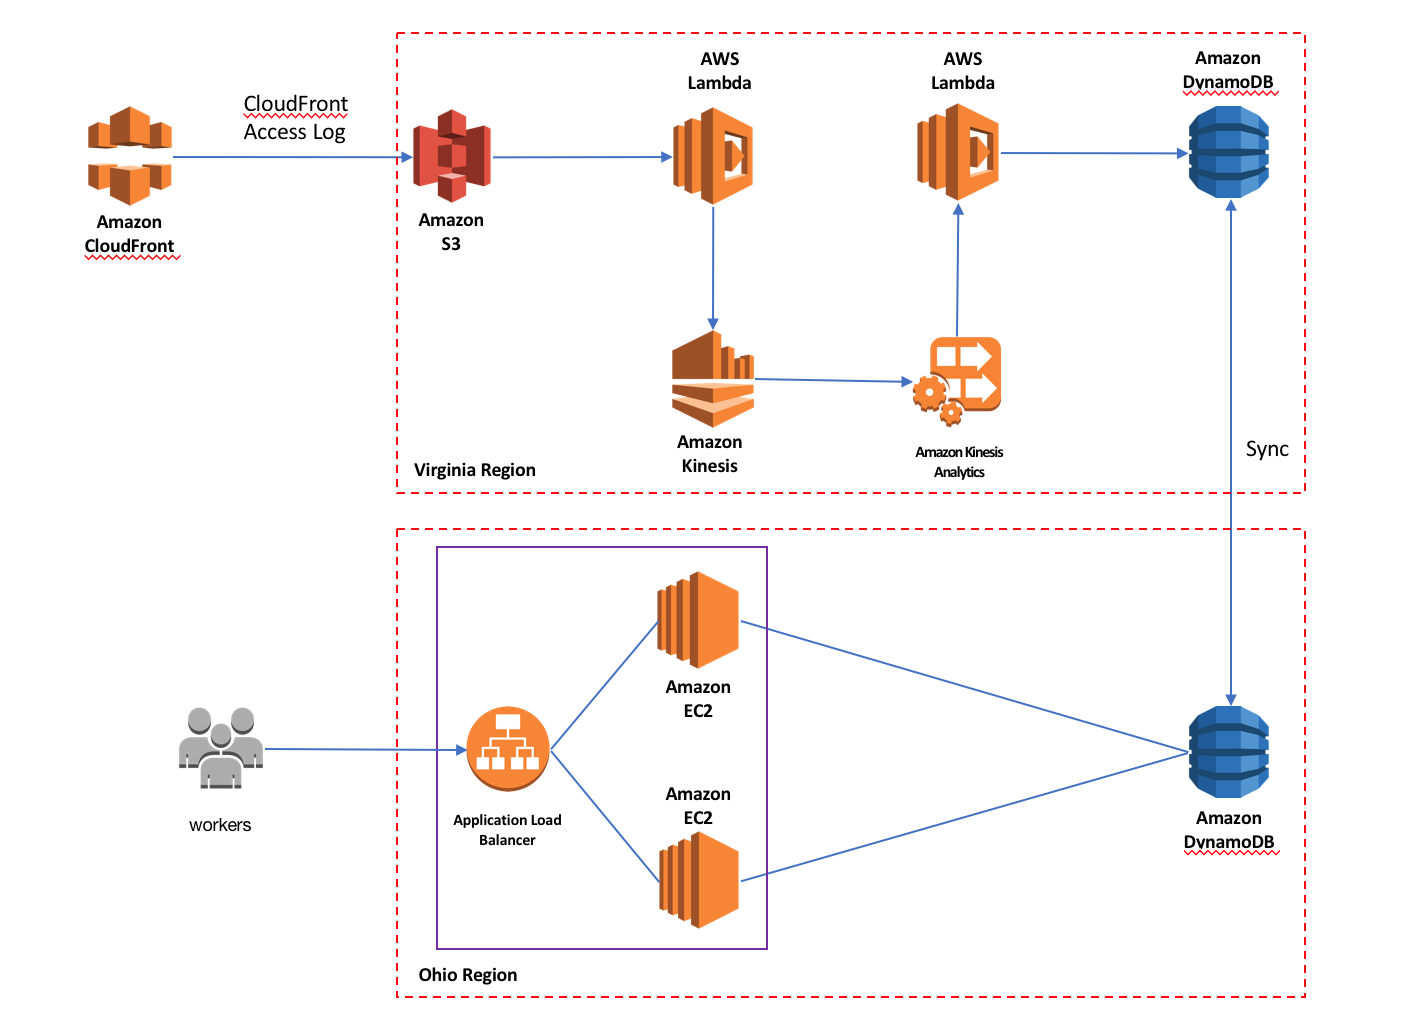
As shown in the figure above:
- CloudFront periodically saves user access logs to an S3 bucket configured by the user.
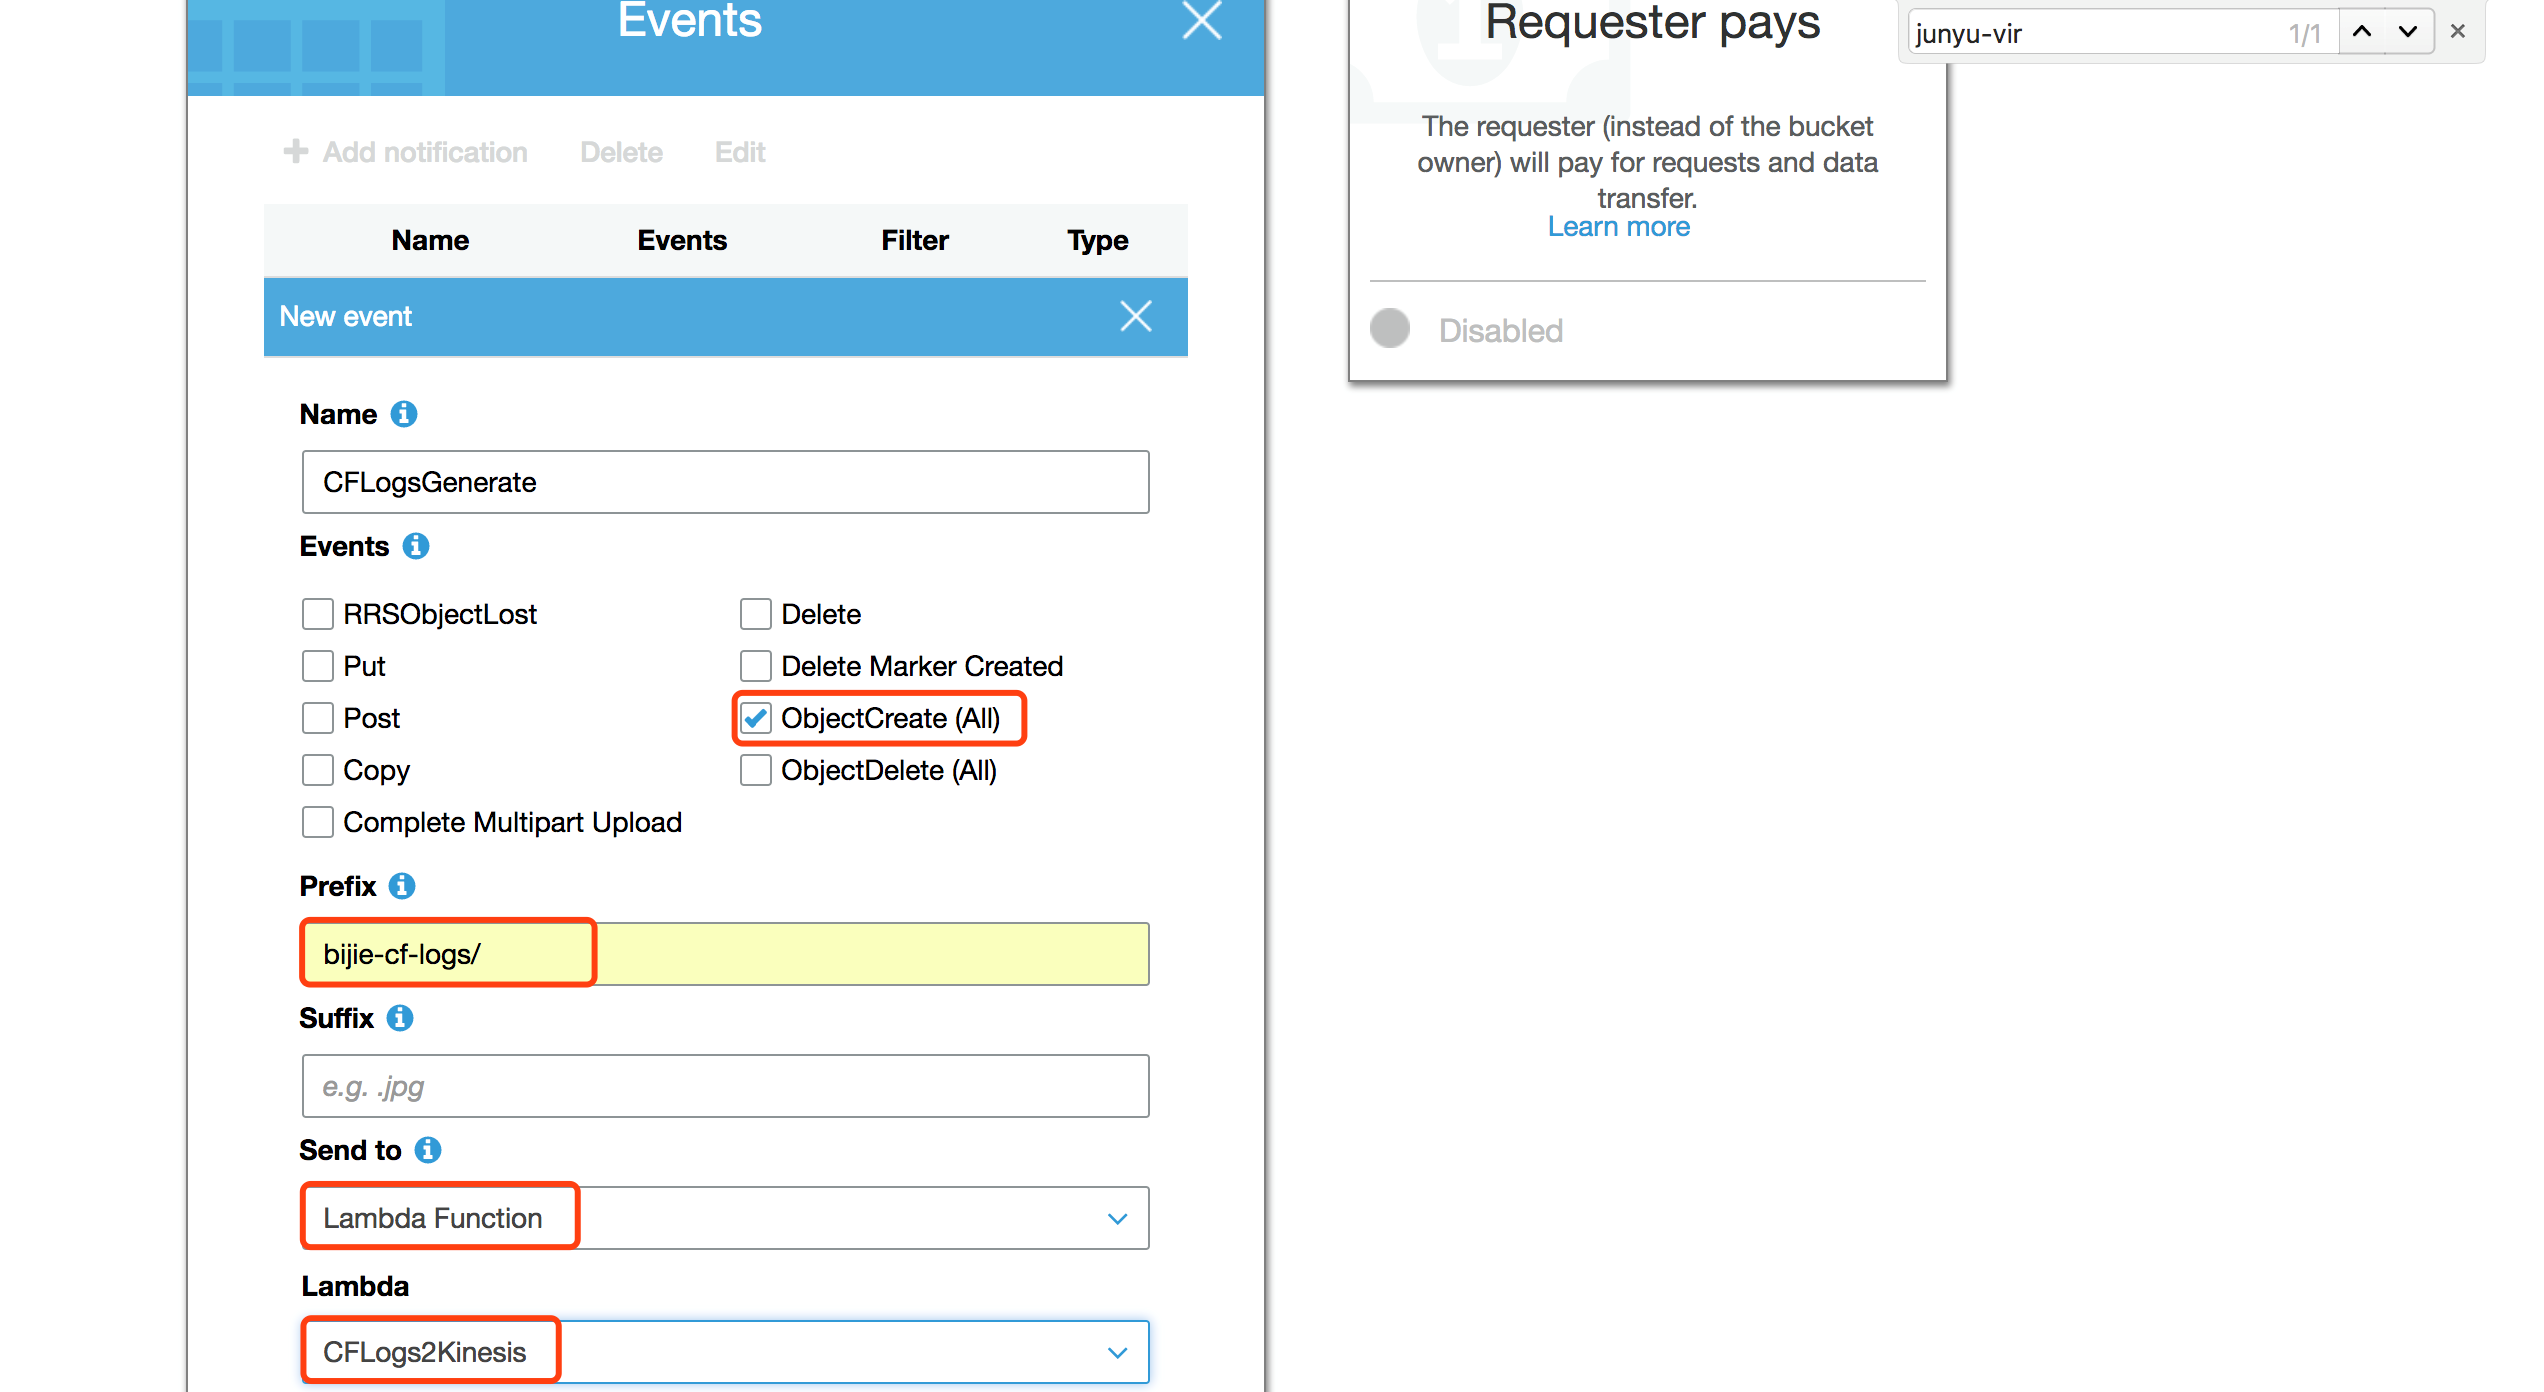
- Once logs are generated on S3, they automatically trigger a Lambda function.
- The Lambda function decompresses the logs and pushes the log content into a Kinesis Stream.
- Kinesis Analytics retrieves log data from the Kinesis Stream and performs real-time analysis.
- The analysis results from Kinesis Analytics are sent to another Lambda function.
- This Lambda function processes the analysis results and stores them in a DynamoDB table in the same region.
- Since DynamoDB Global Tables are enabled, the analysis results are automatically synchronized to DynamoDB tables in other regions.
- In the region where the user’s business resides, a simple web application can be built using ALB and EC2 to display real-time analysis of the data in the DynamoDB table.
This article assumes that the user’s business is located in the Ohio region. Since Ohio does not yet support the Kinesis Analytics service, all analysis components are deployed in the Virginia region, with only the analysis results synchronized back to the DynamoDB table in Ohio. Furthermore, regarding the ALB and EC2 parts in the diagram, this article does not provide detailed setup instructions. Users can use their preferred development language to develop the display page or use API Gateway and Lambda to build a serverless display system.
Now, let’s see how to quickly build such a real-time analytics platform.
Step 1: Preparation
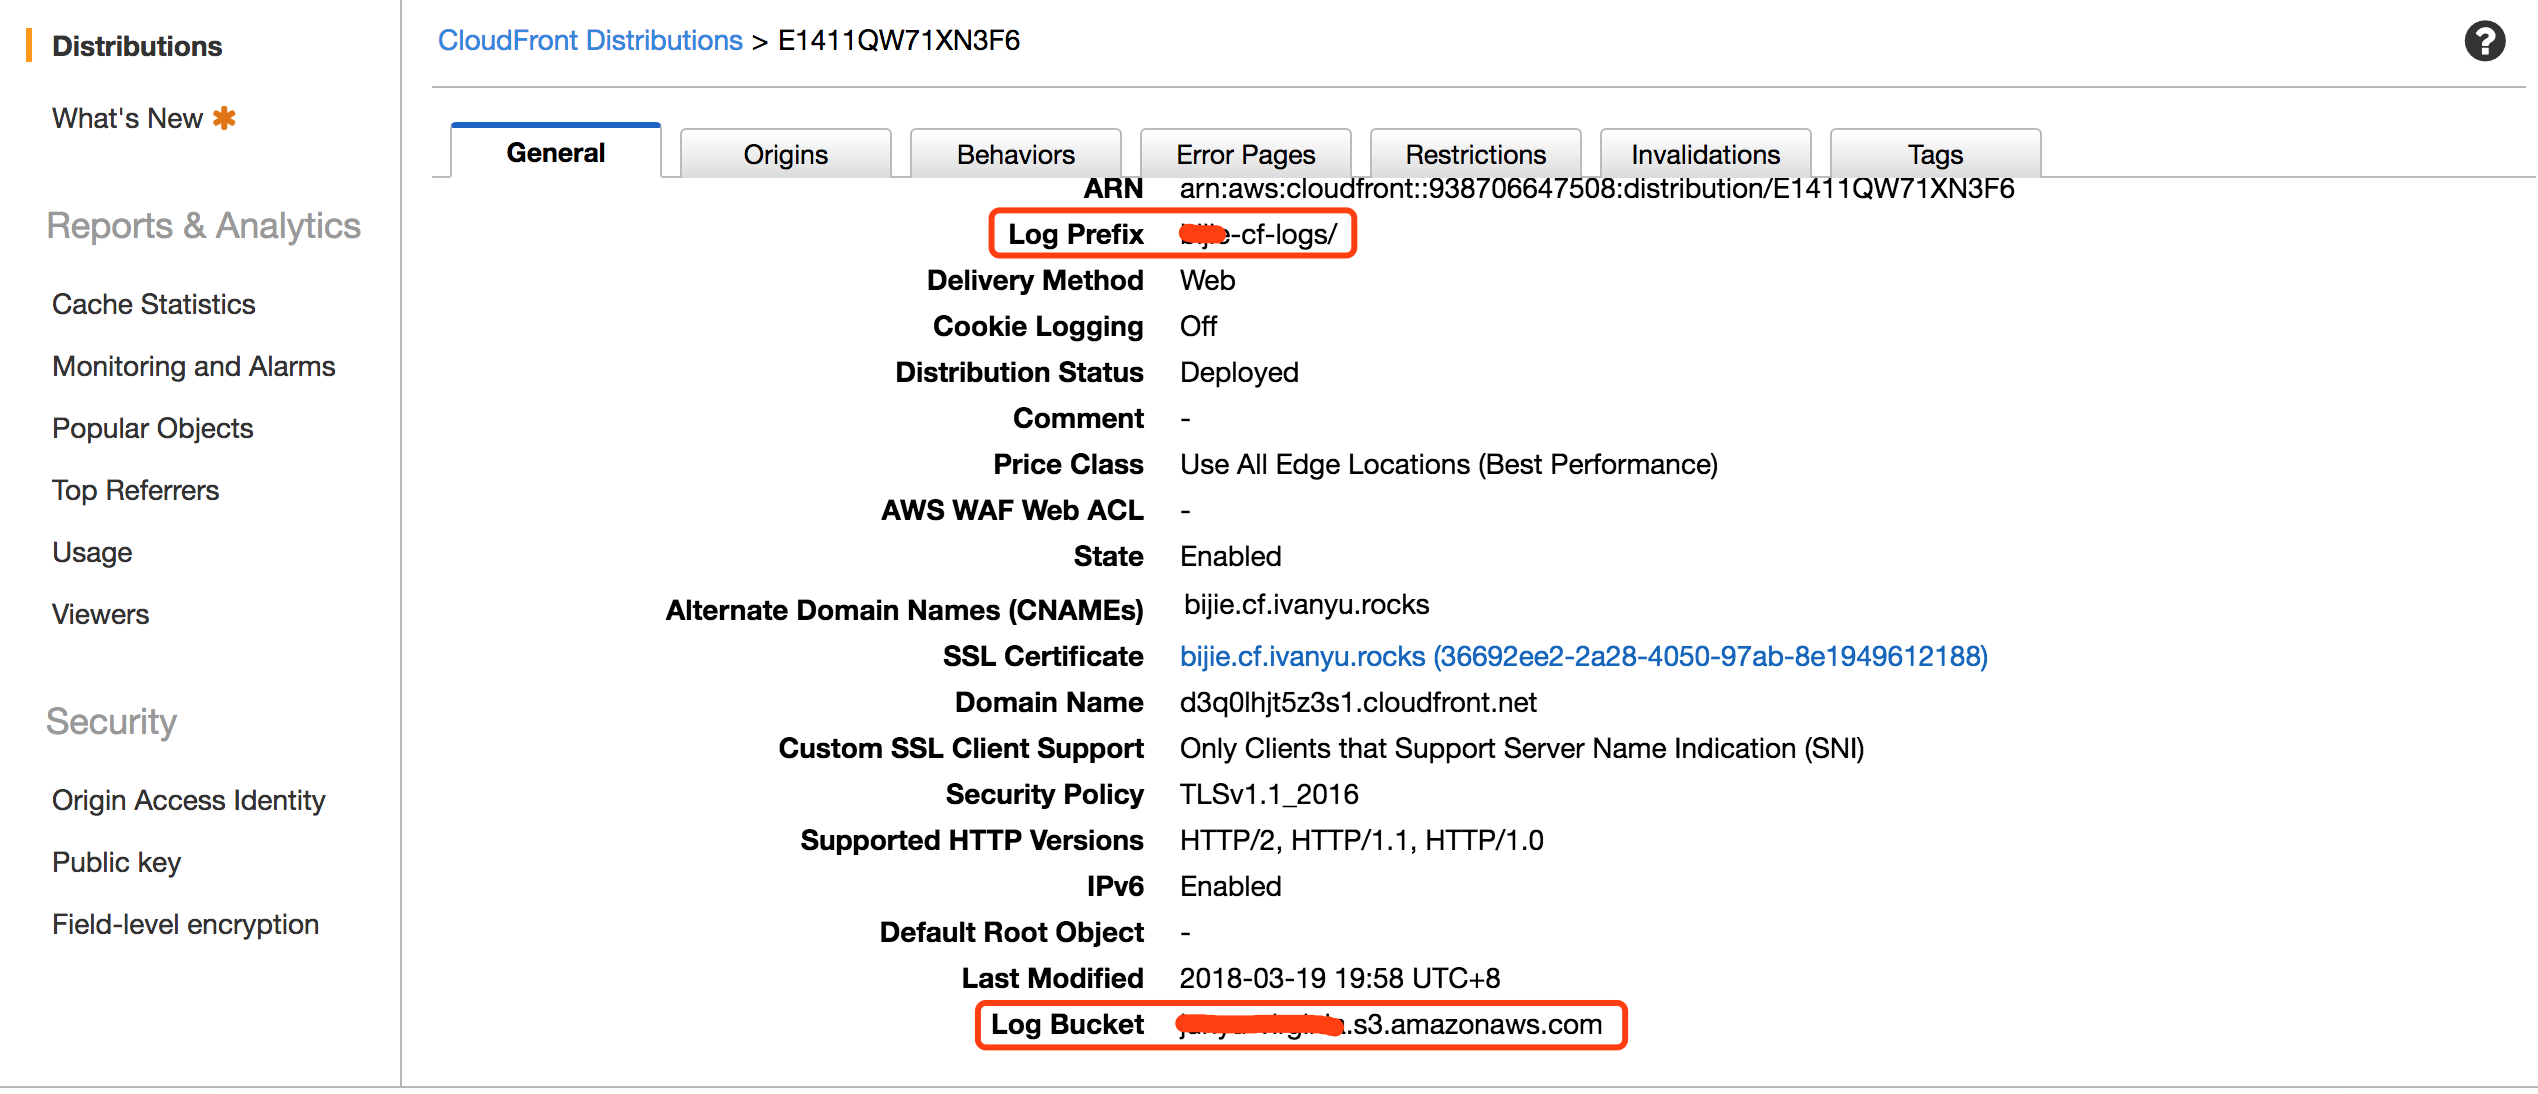
First, enable CloudFront logging.
Create a Lambda function to parse CloudFront logs and push them into the Kinesis stream. The Lambda code can be downloaded from the following address:
https://github.com/iwasnobody/cflogs2analytics2ddb/blob/master/CFLogs2Kinesis.py 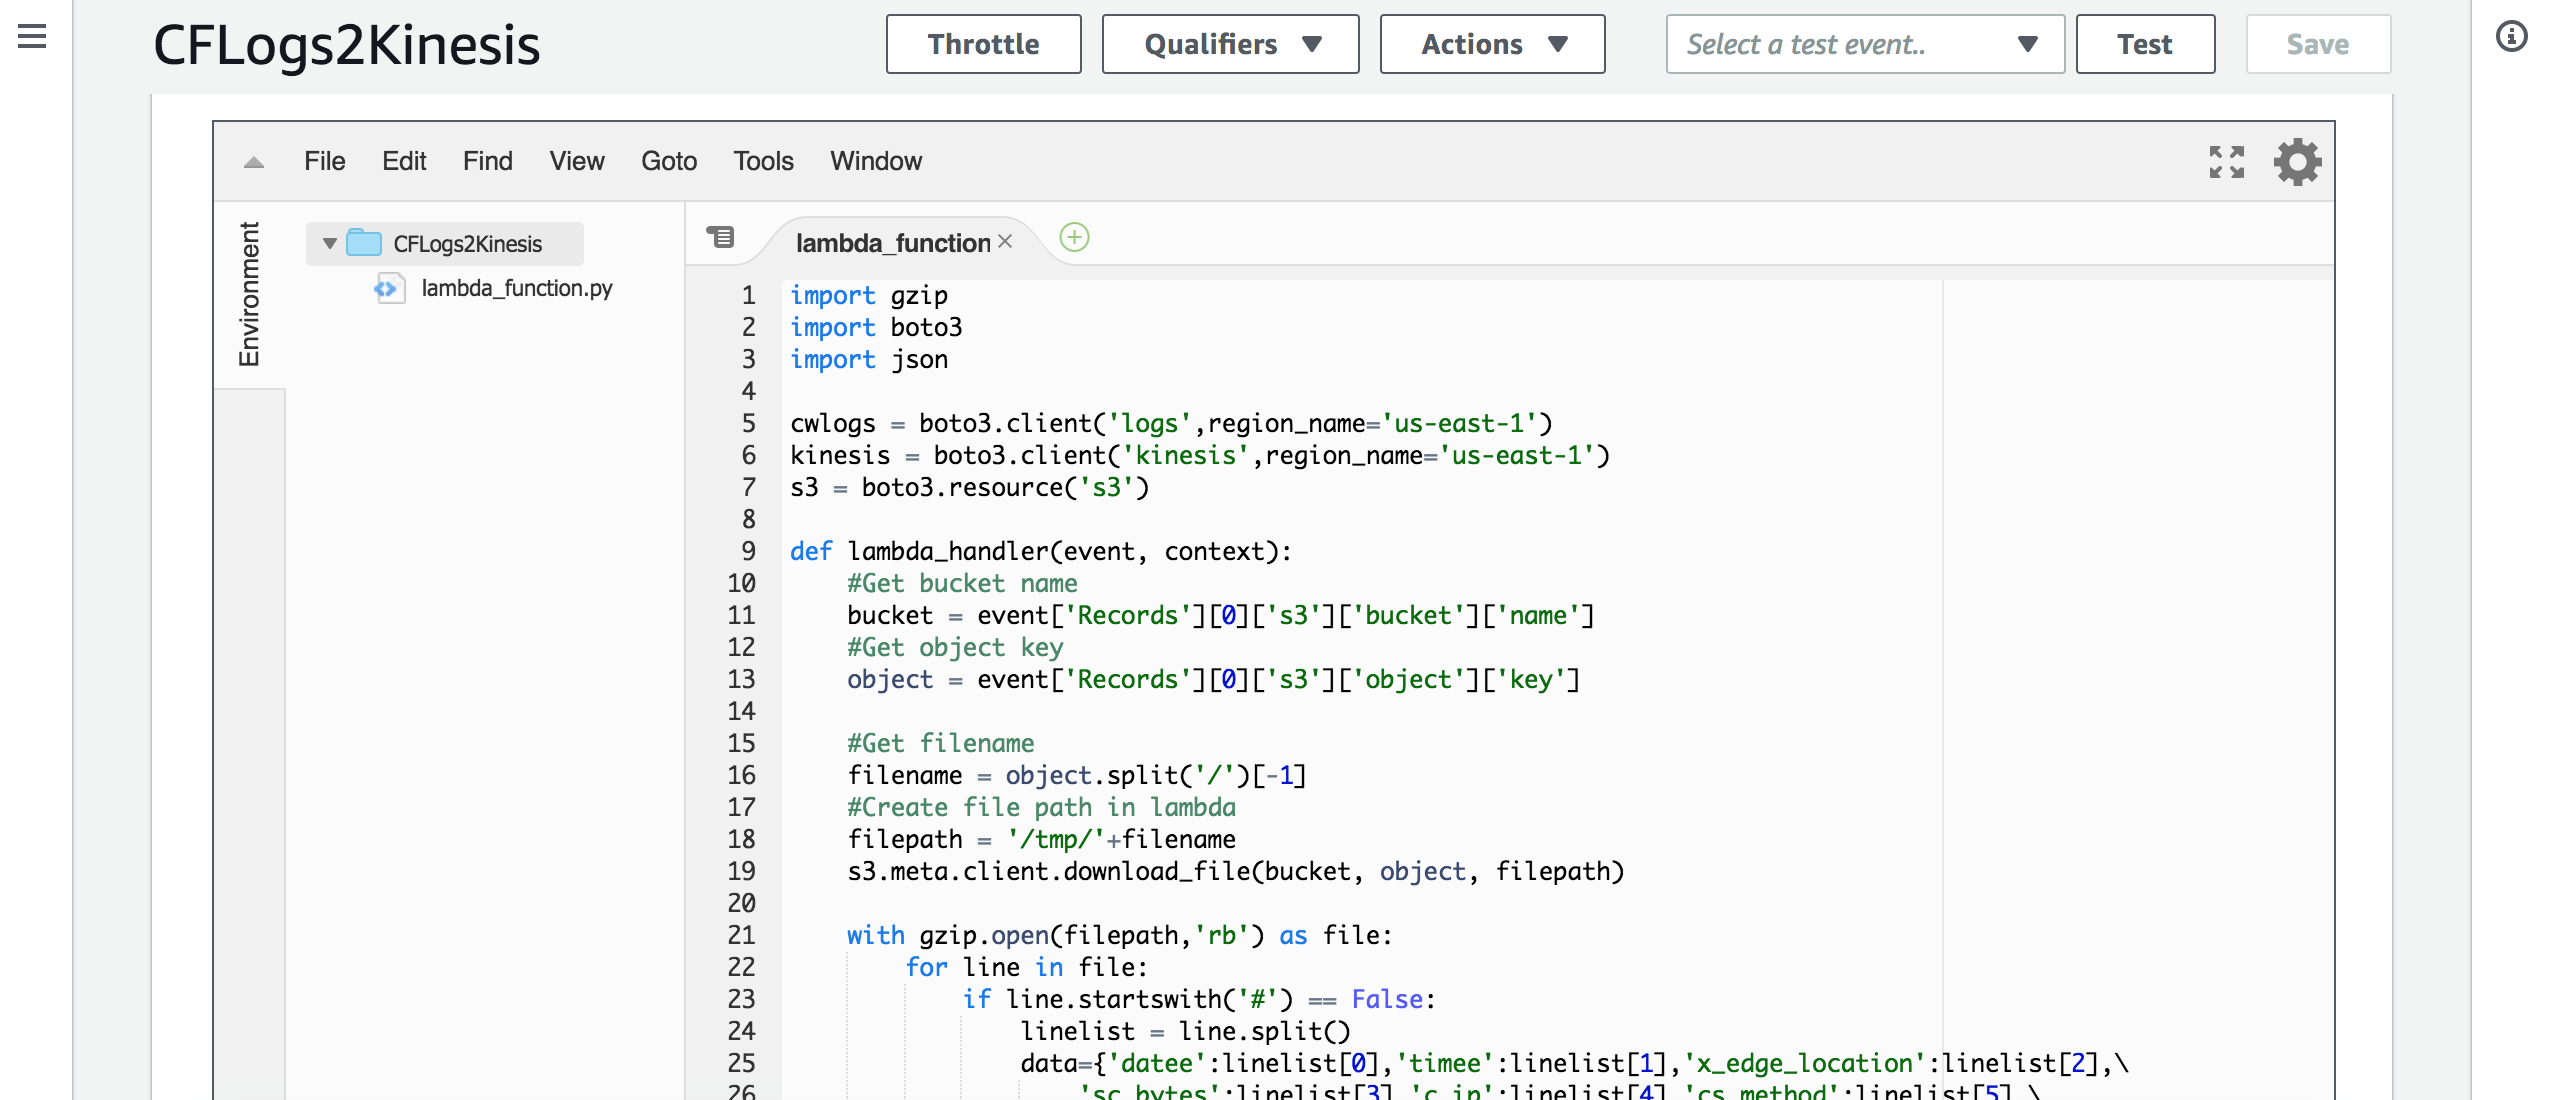
Navigate to the S3 bucket where CloudFront logs are saved.
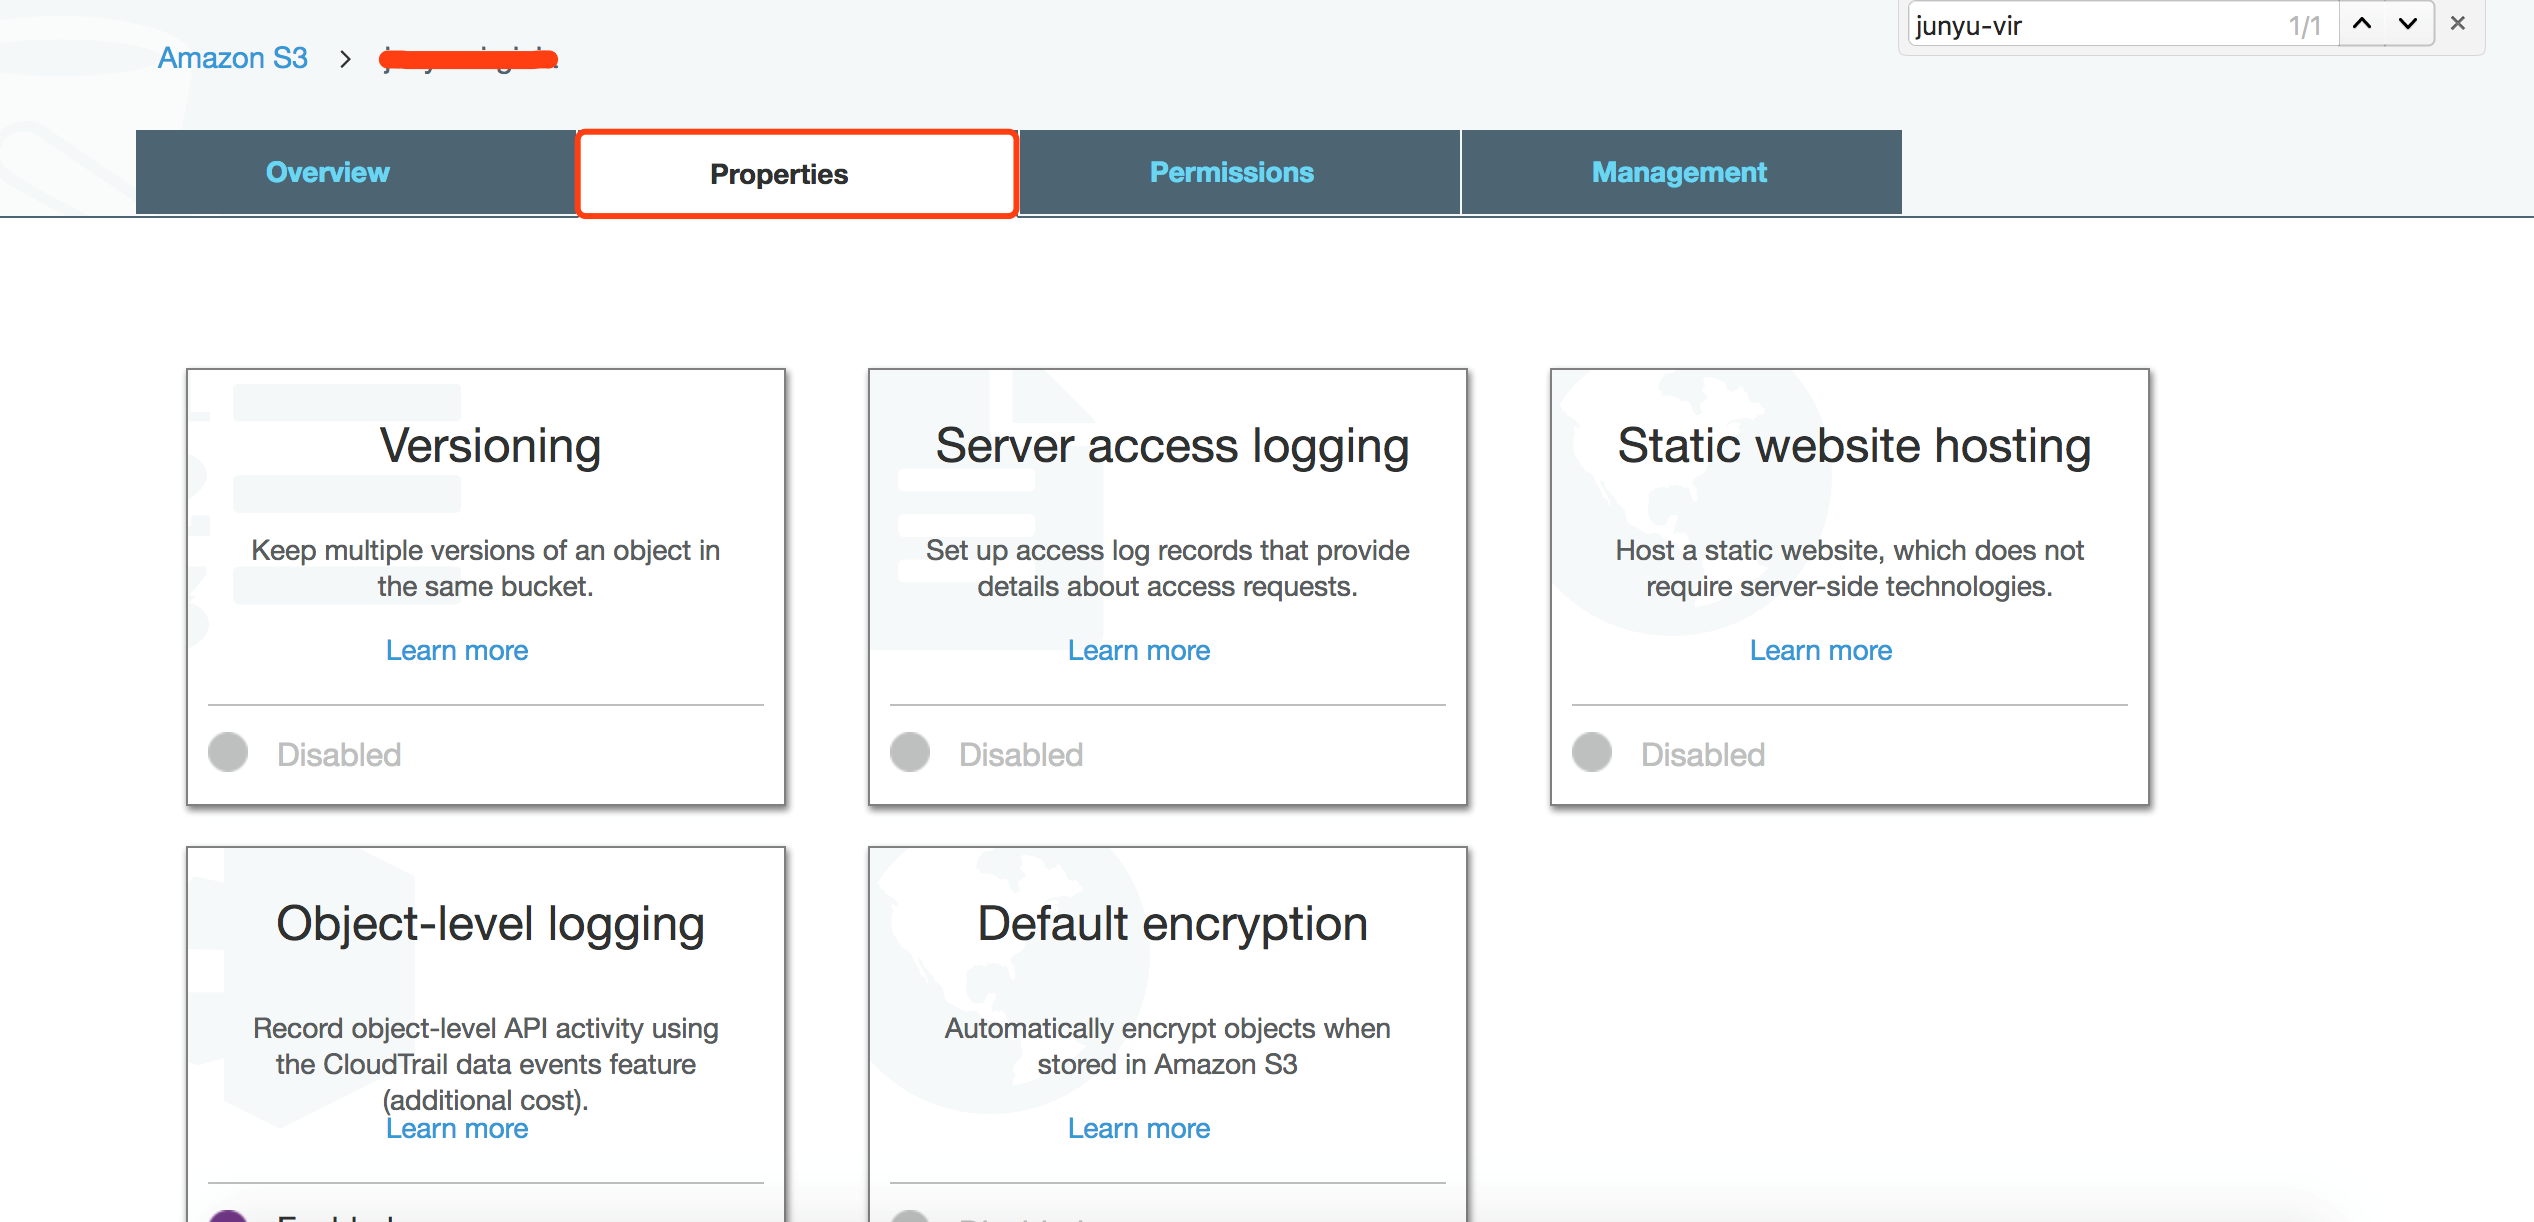
Configure it to trigger the previously created Lambda function when new log files are generated. 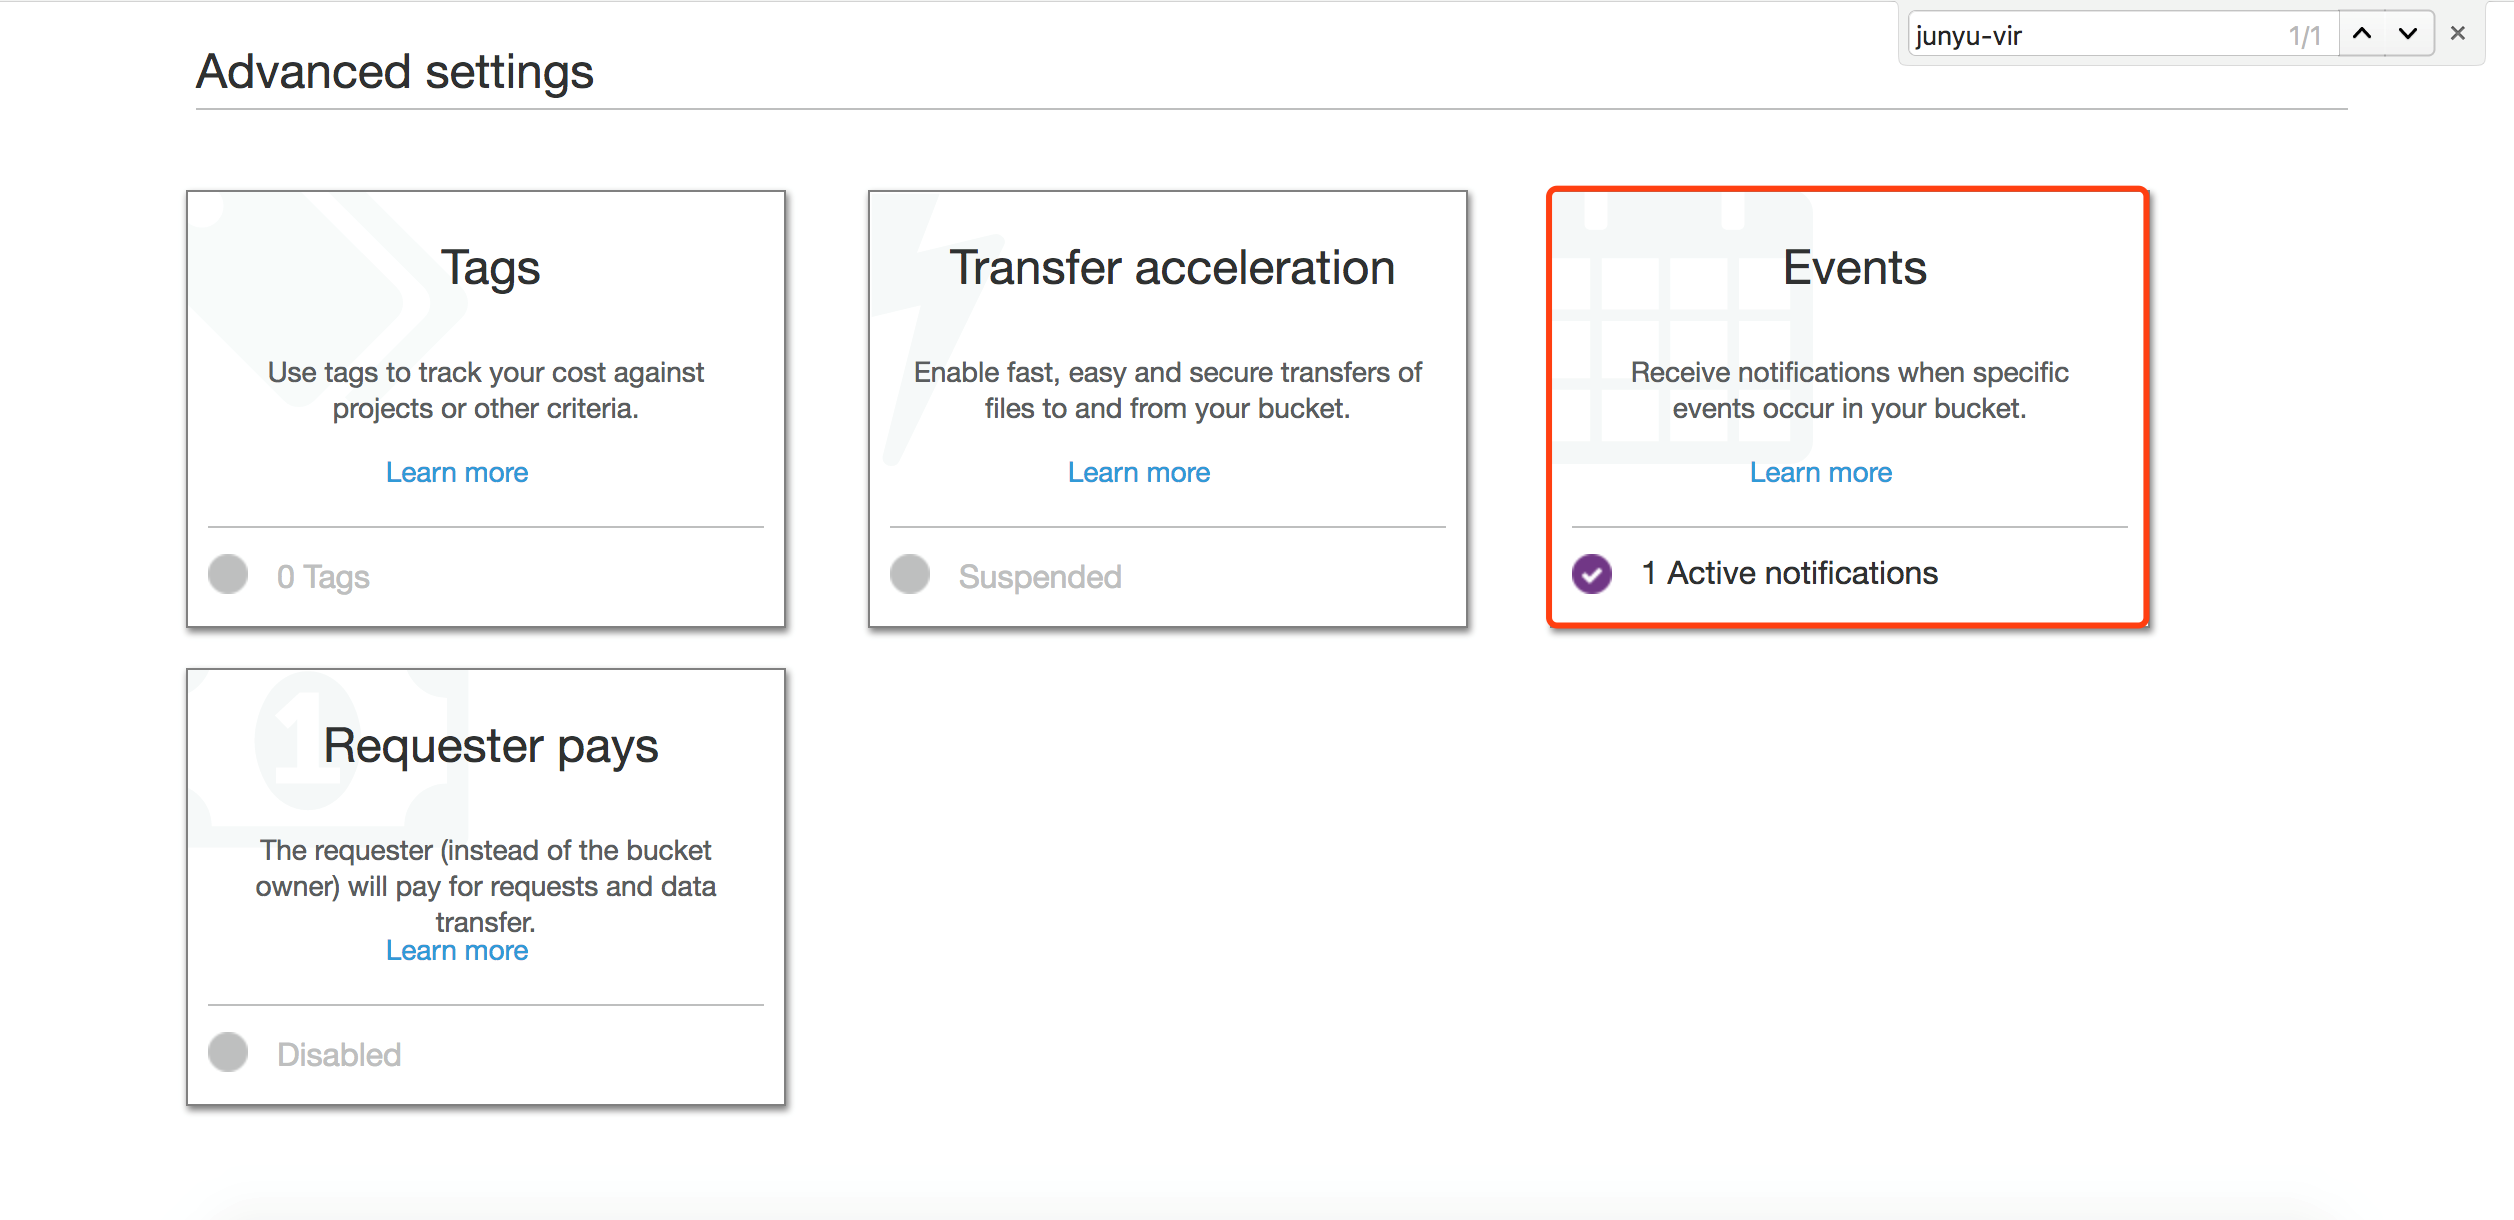
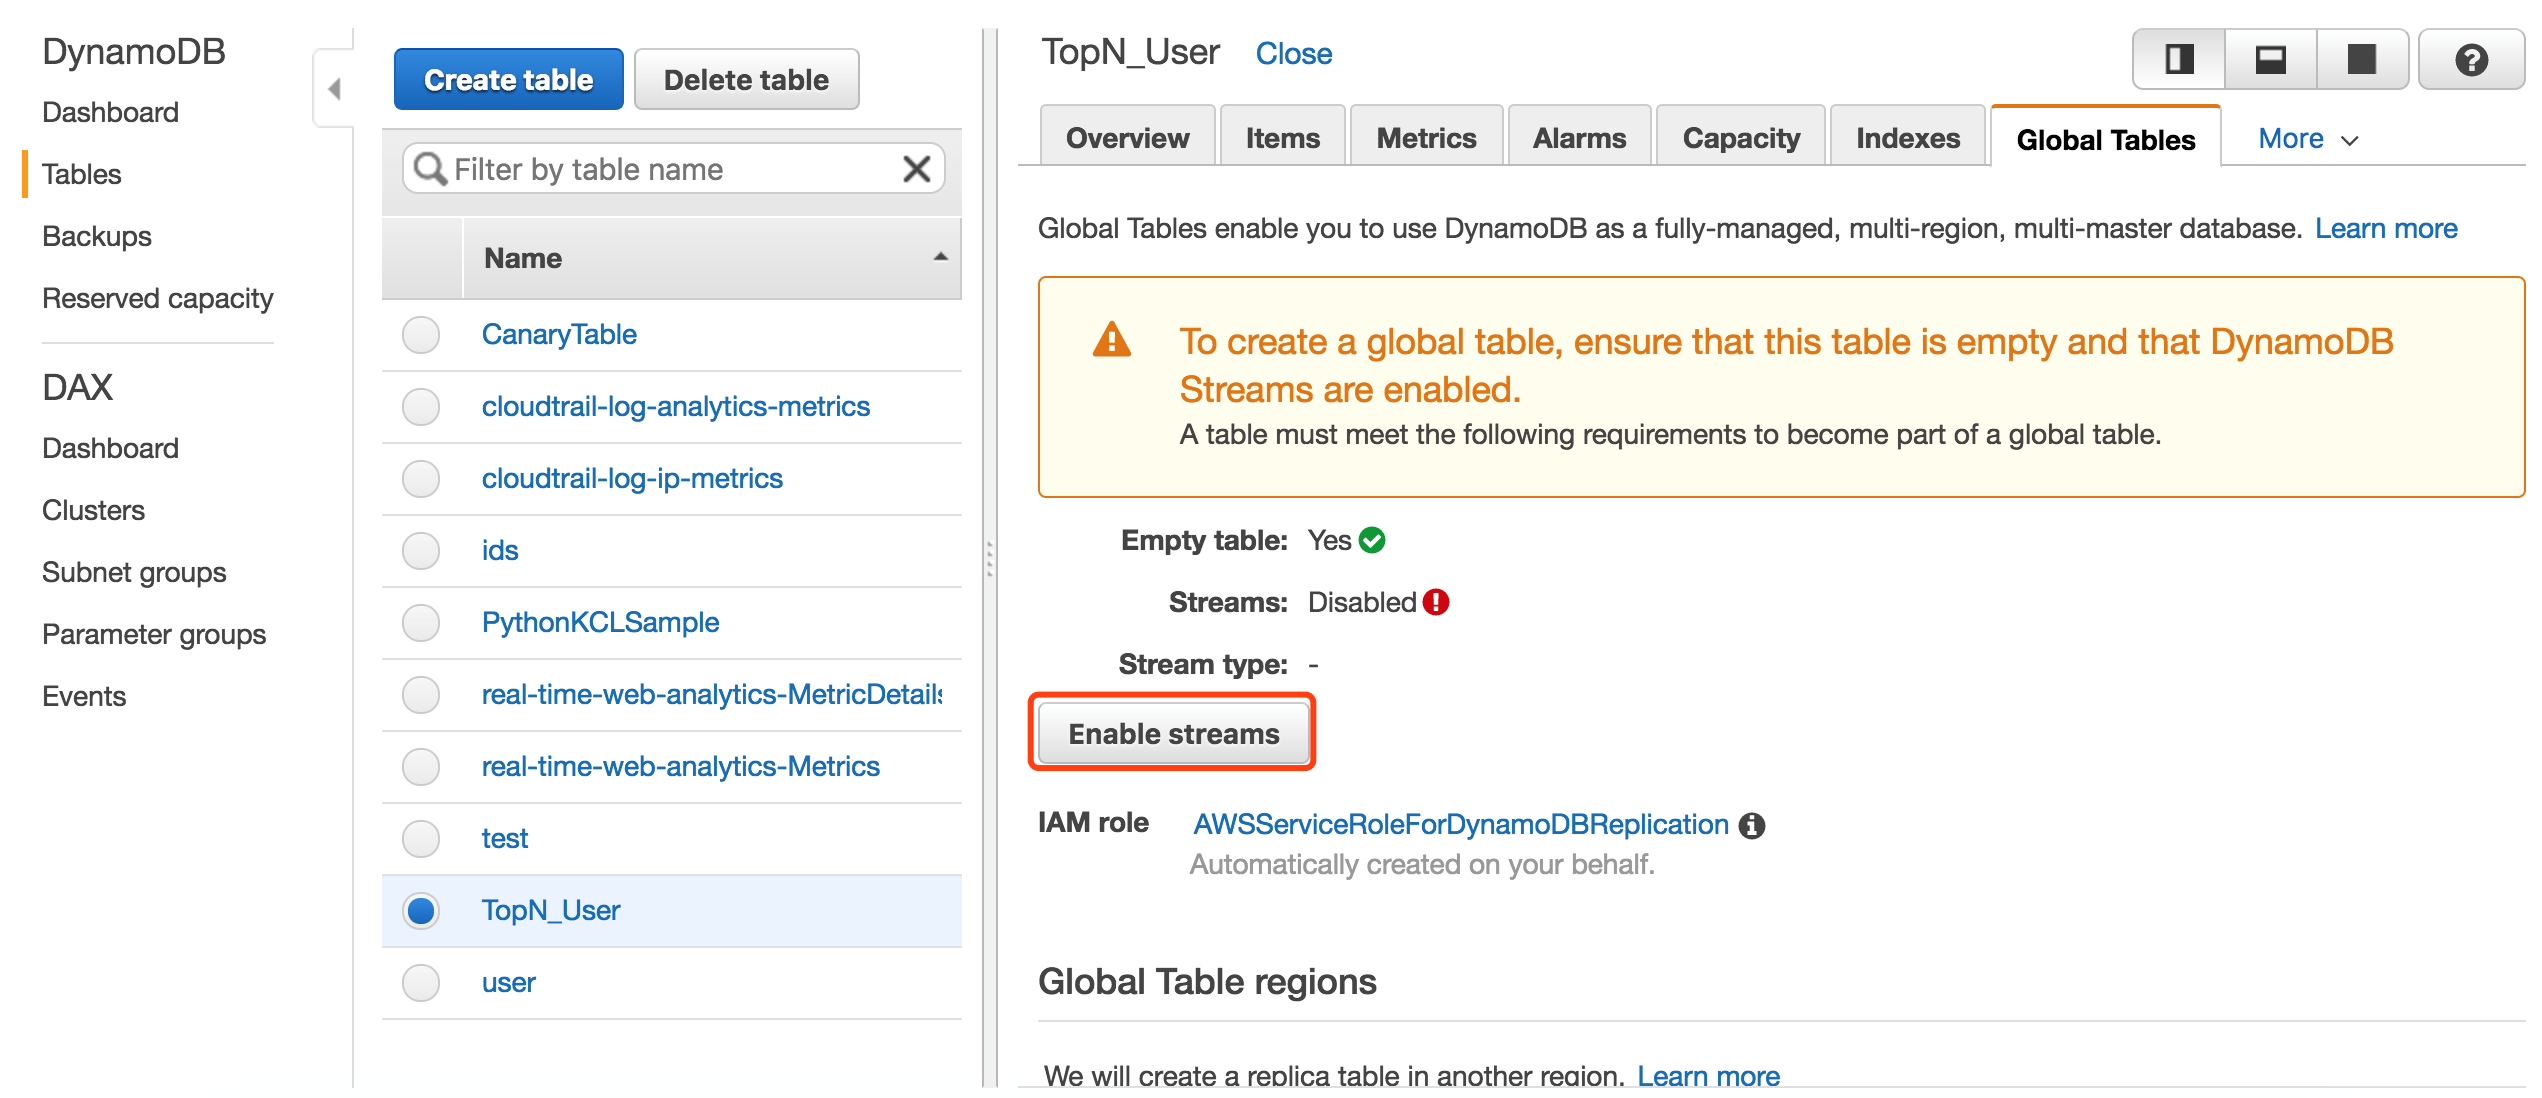
Create a DynamoDB table to store the results of Kinesis Analytics.
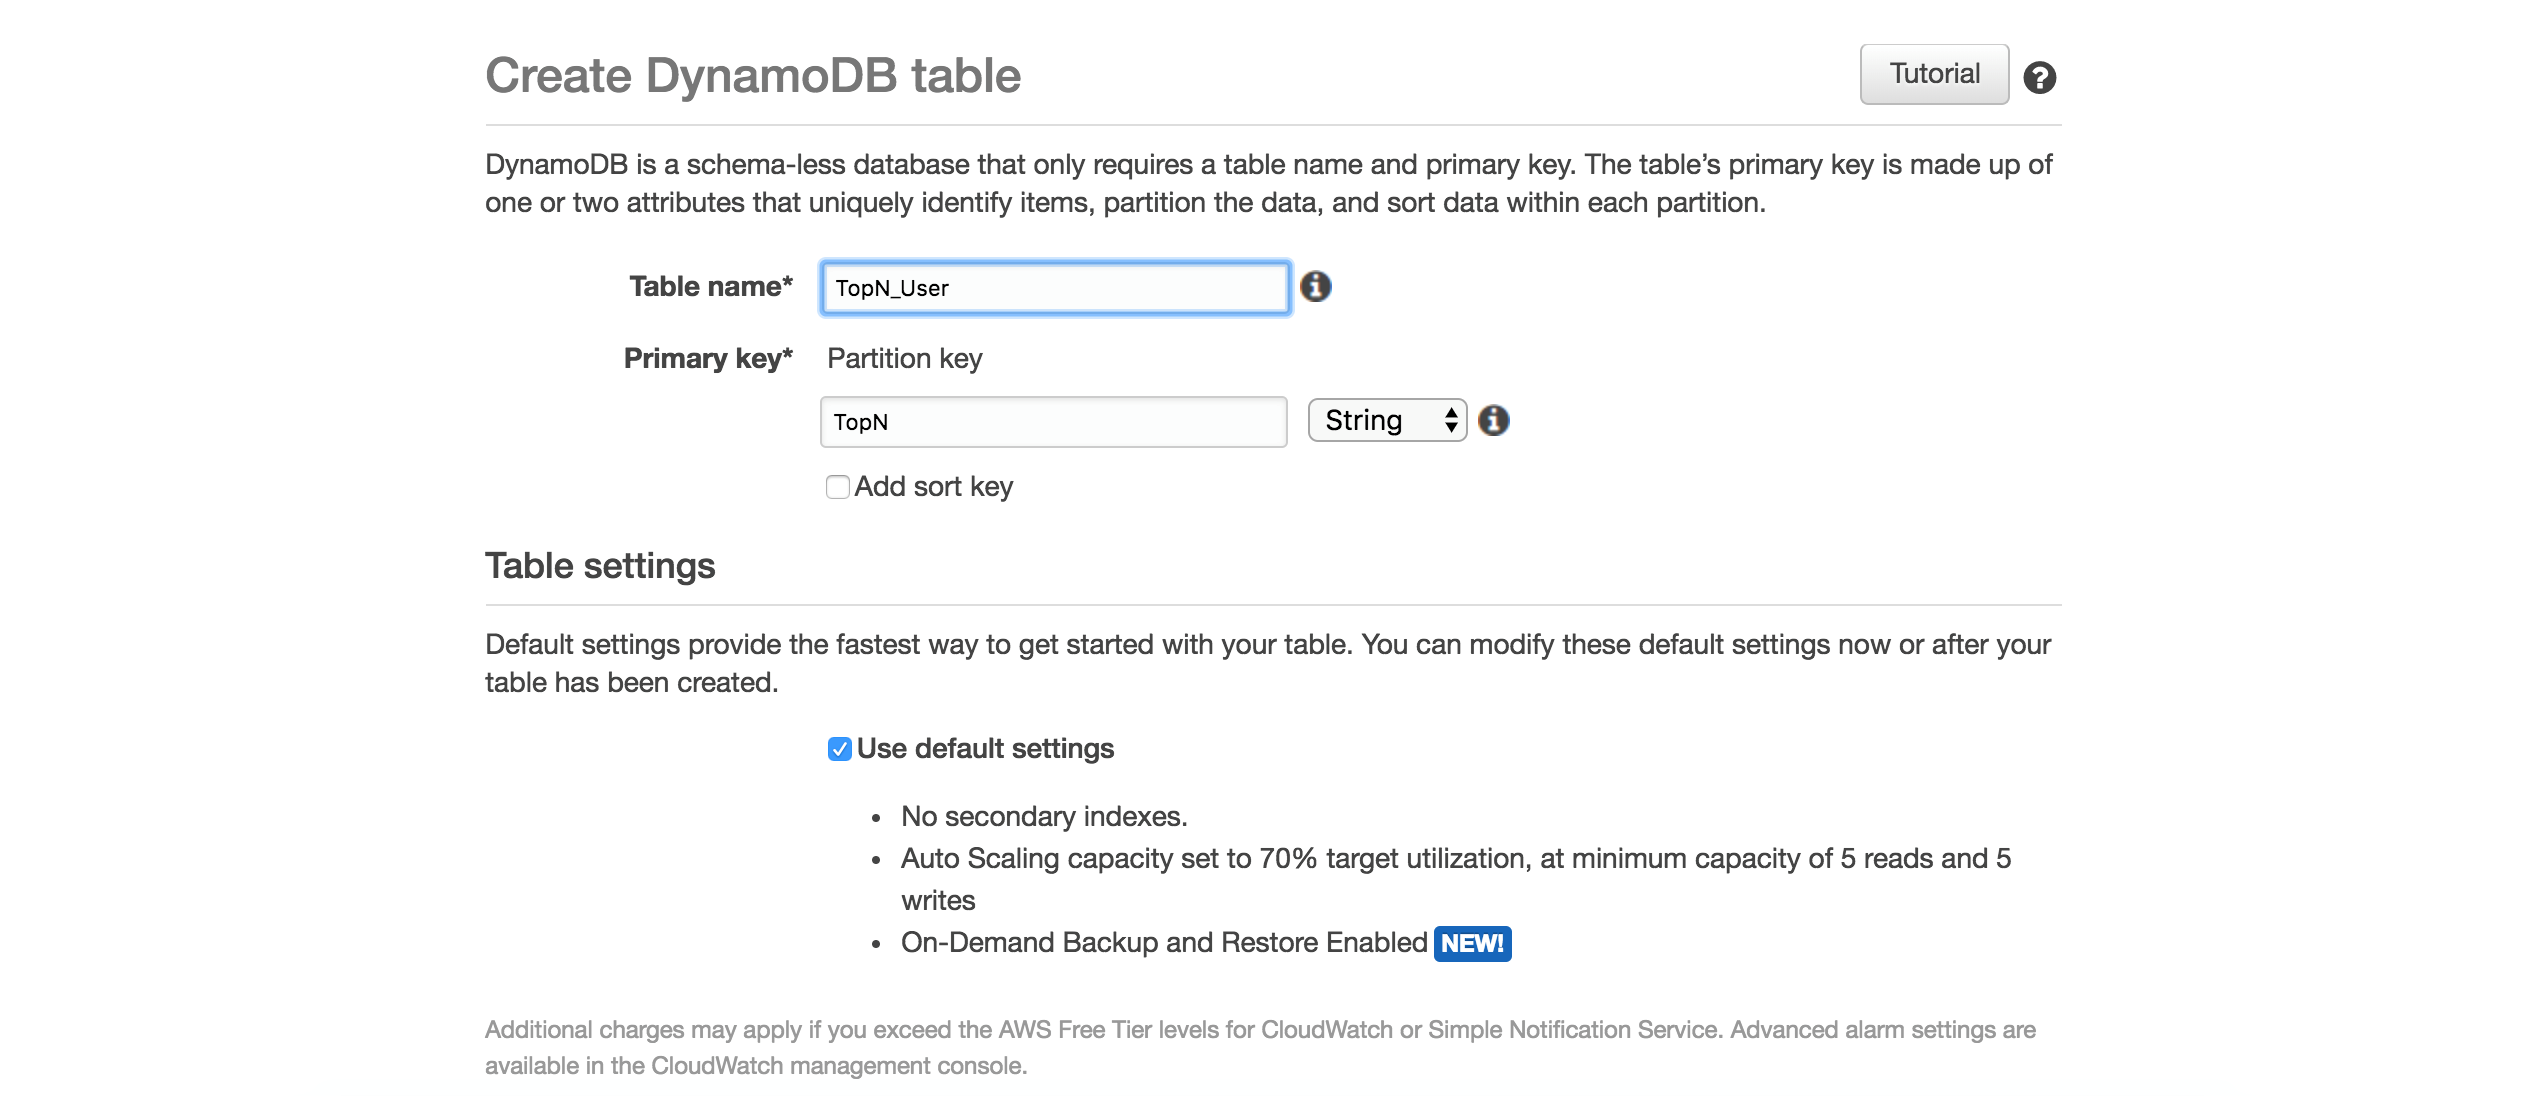
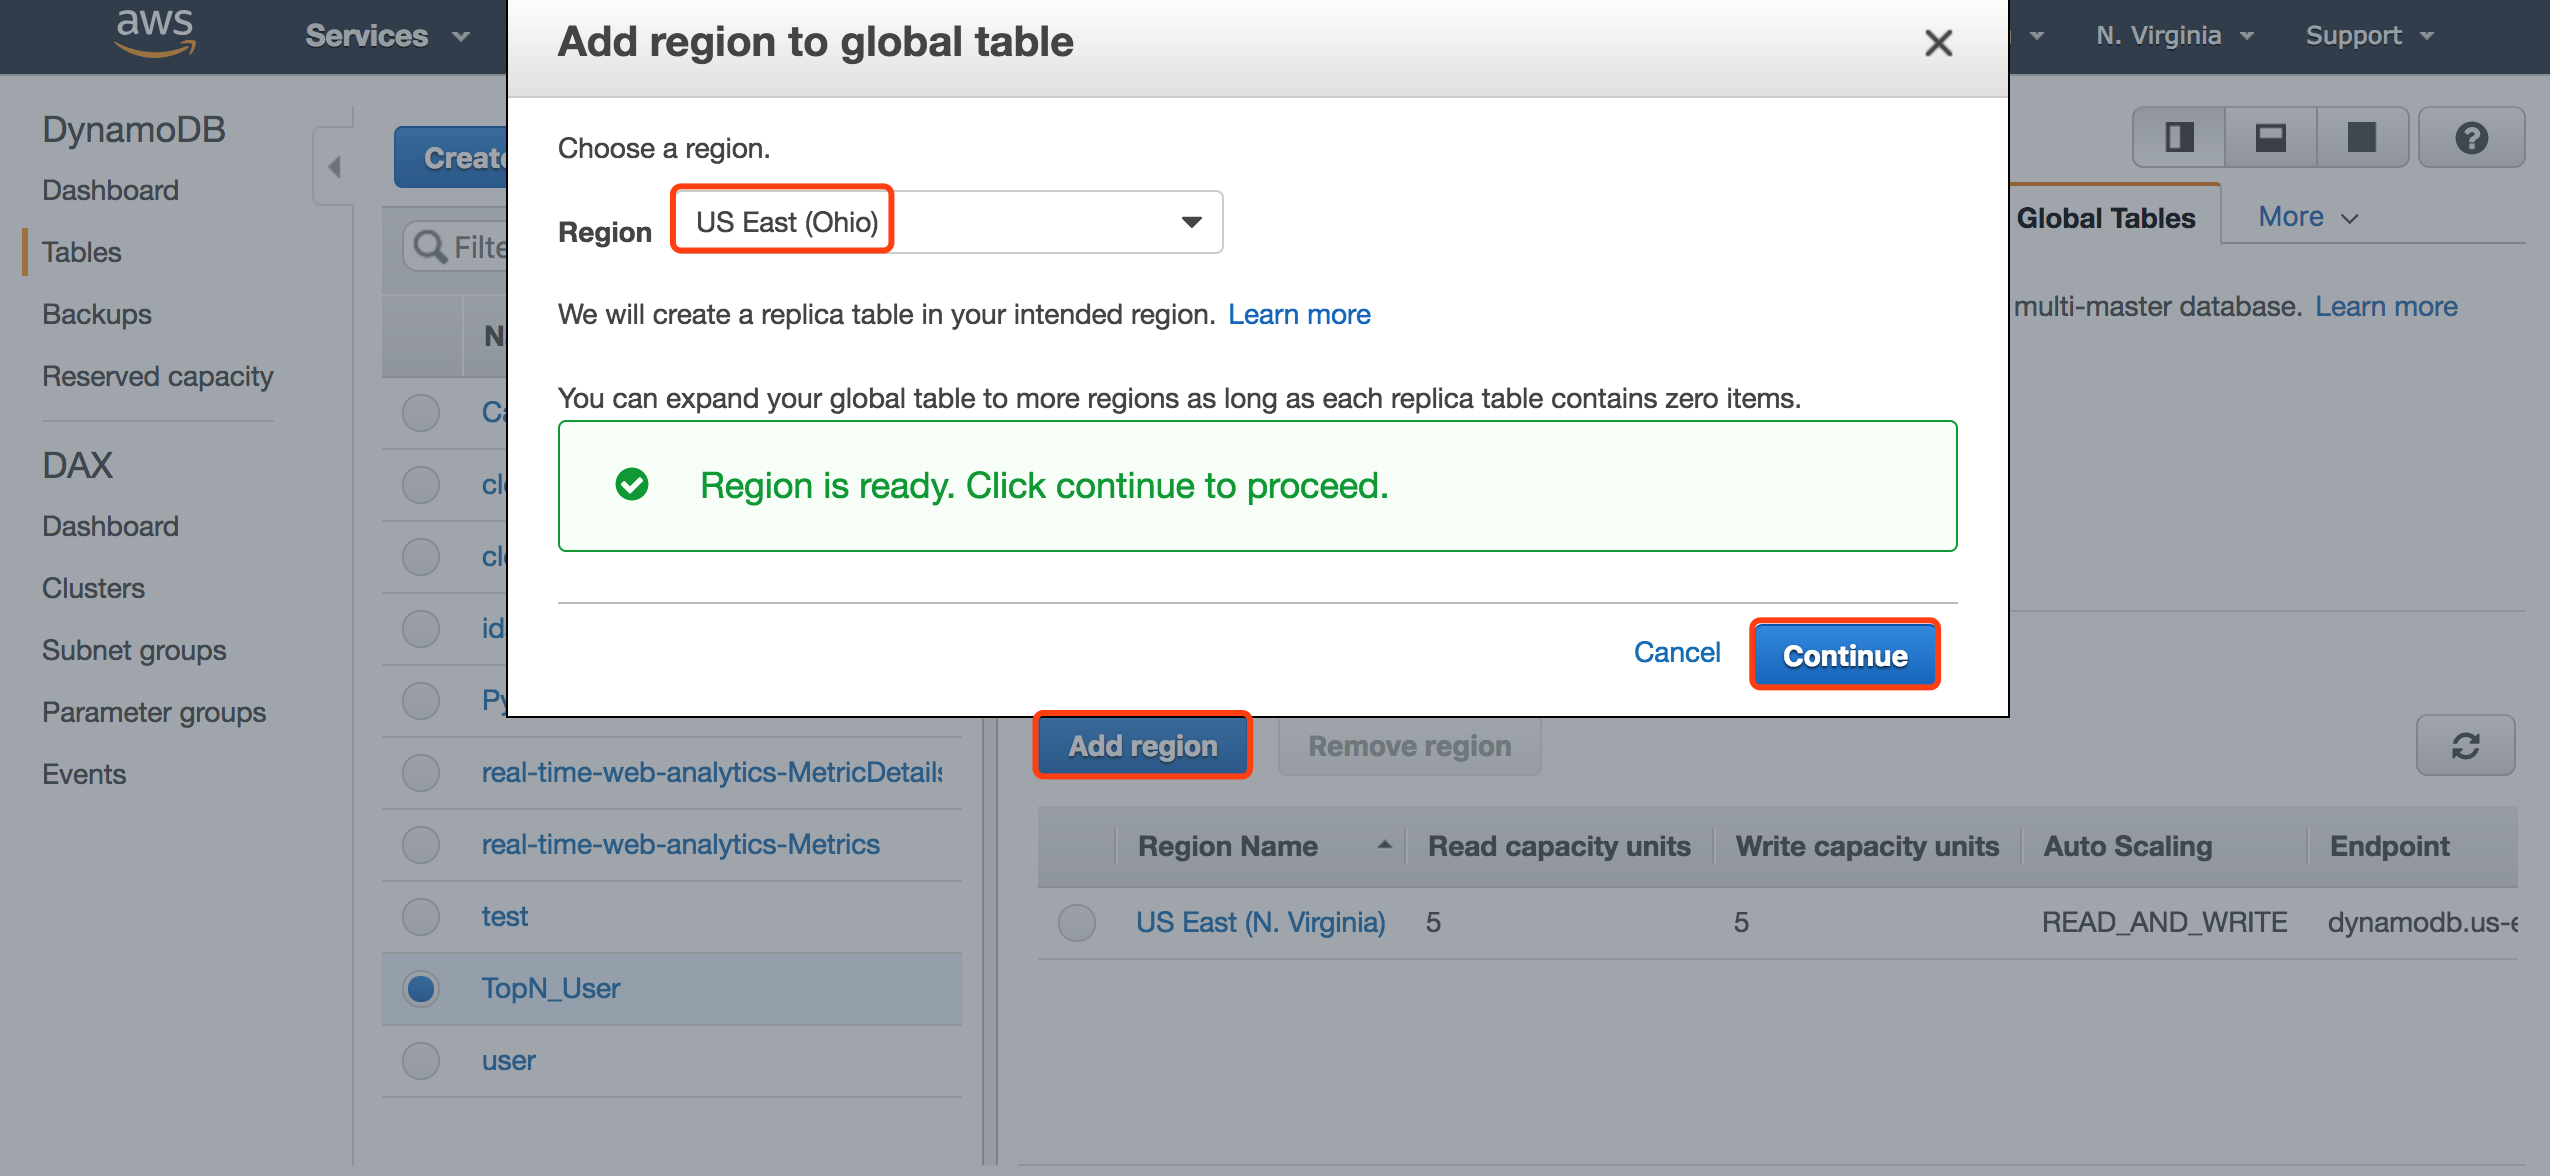
Set the created table as a global table and synchronize it with the Ohio region.
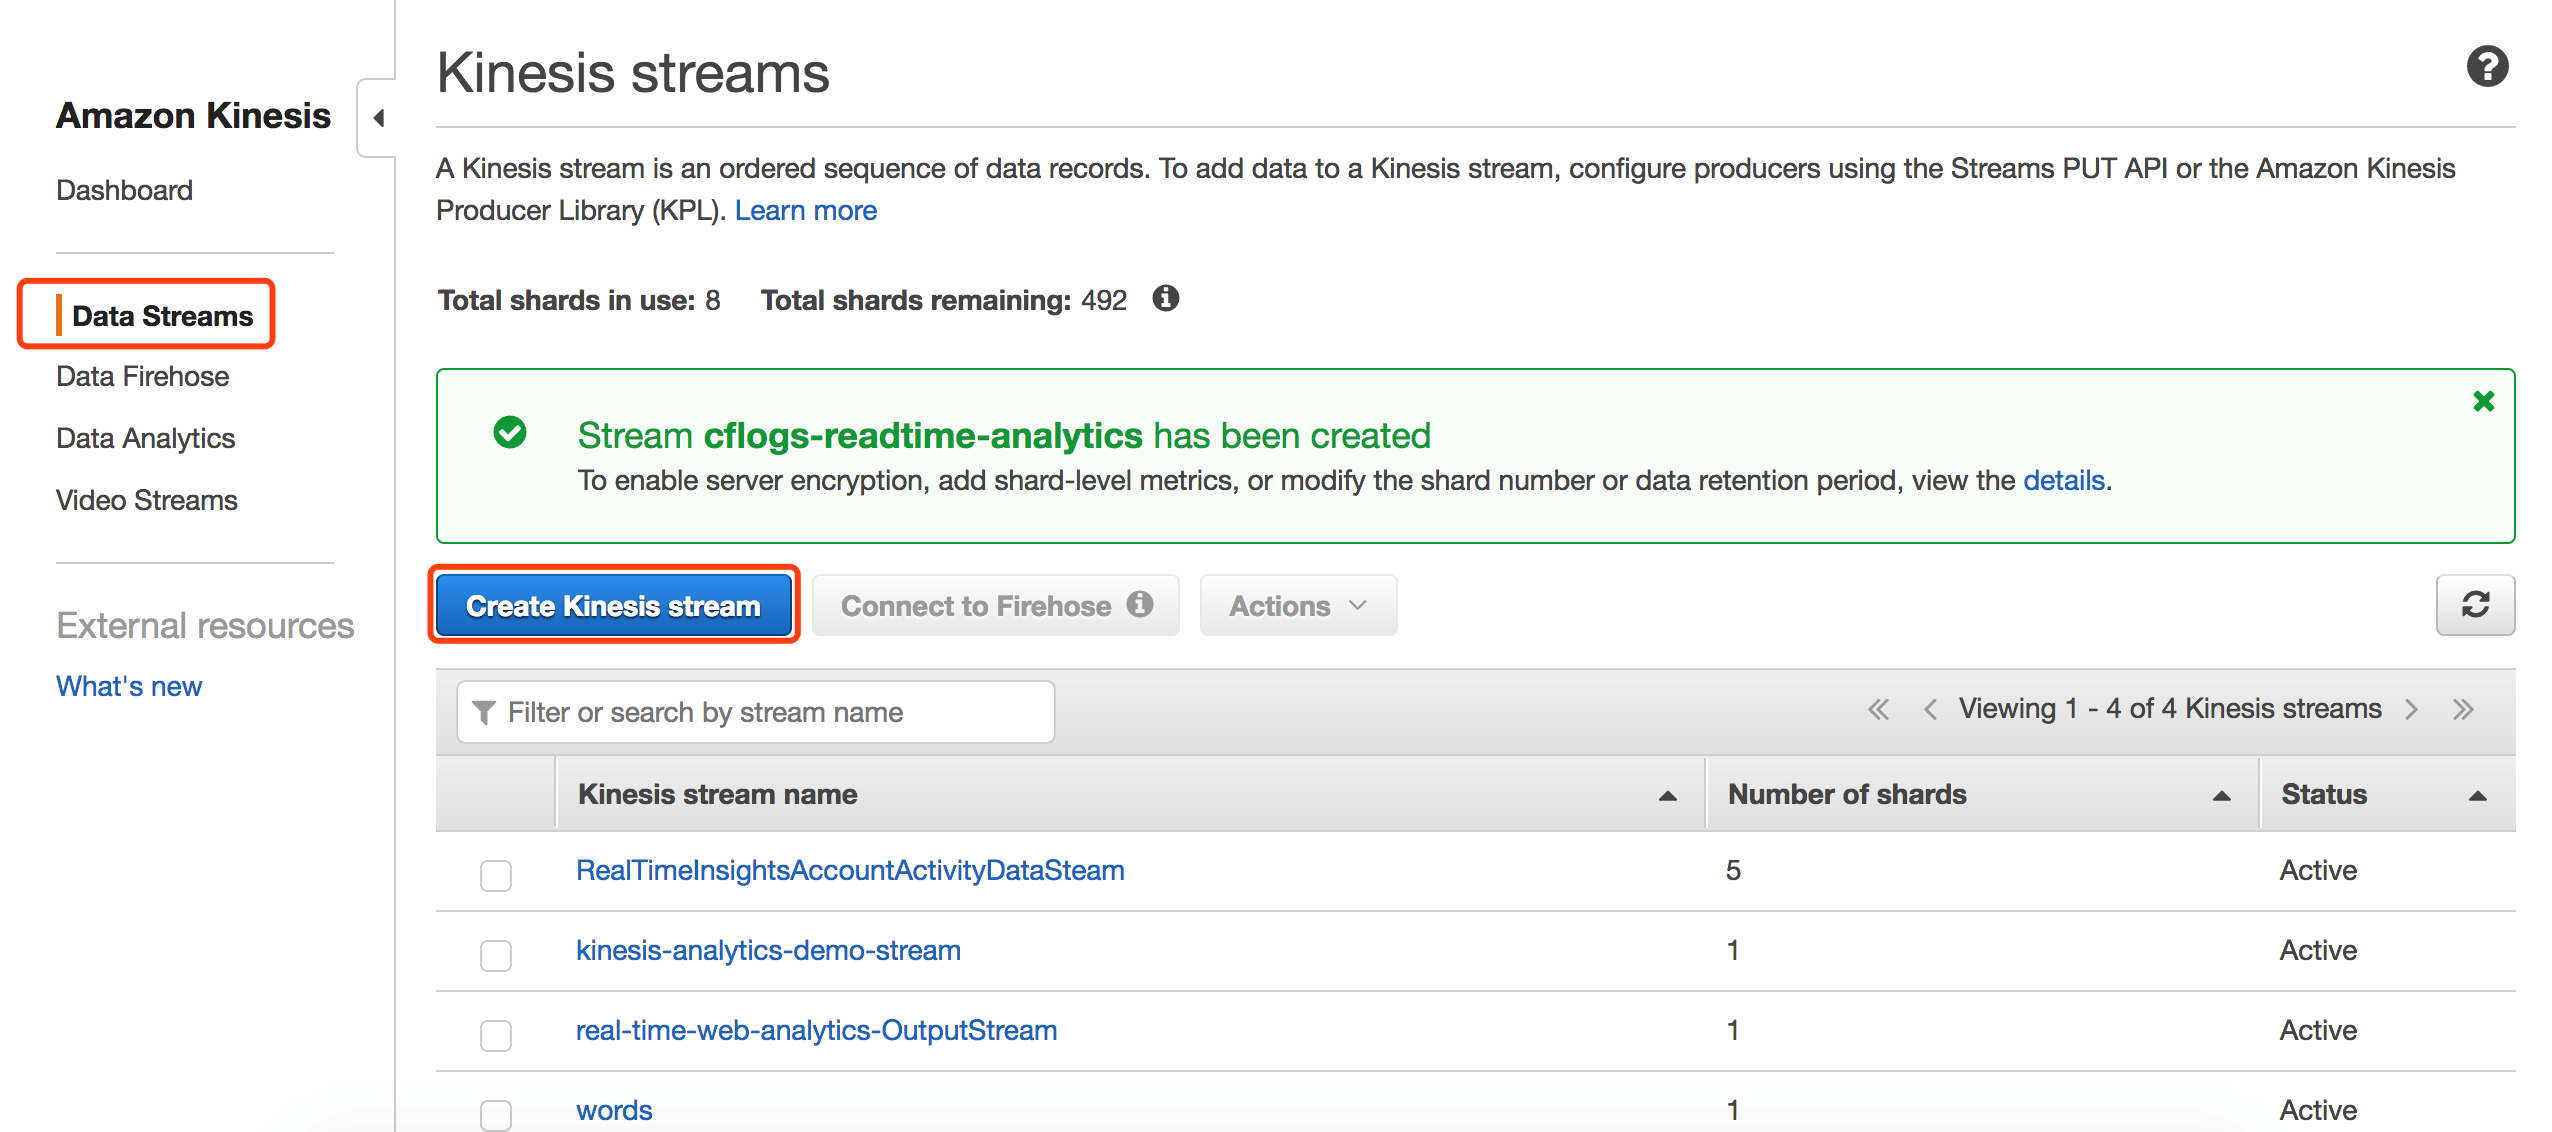
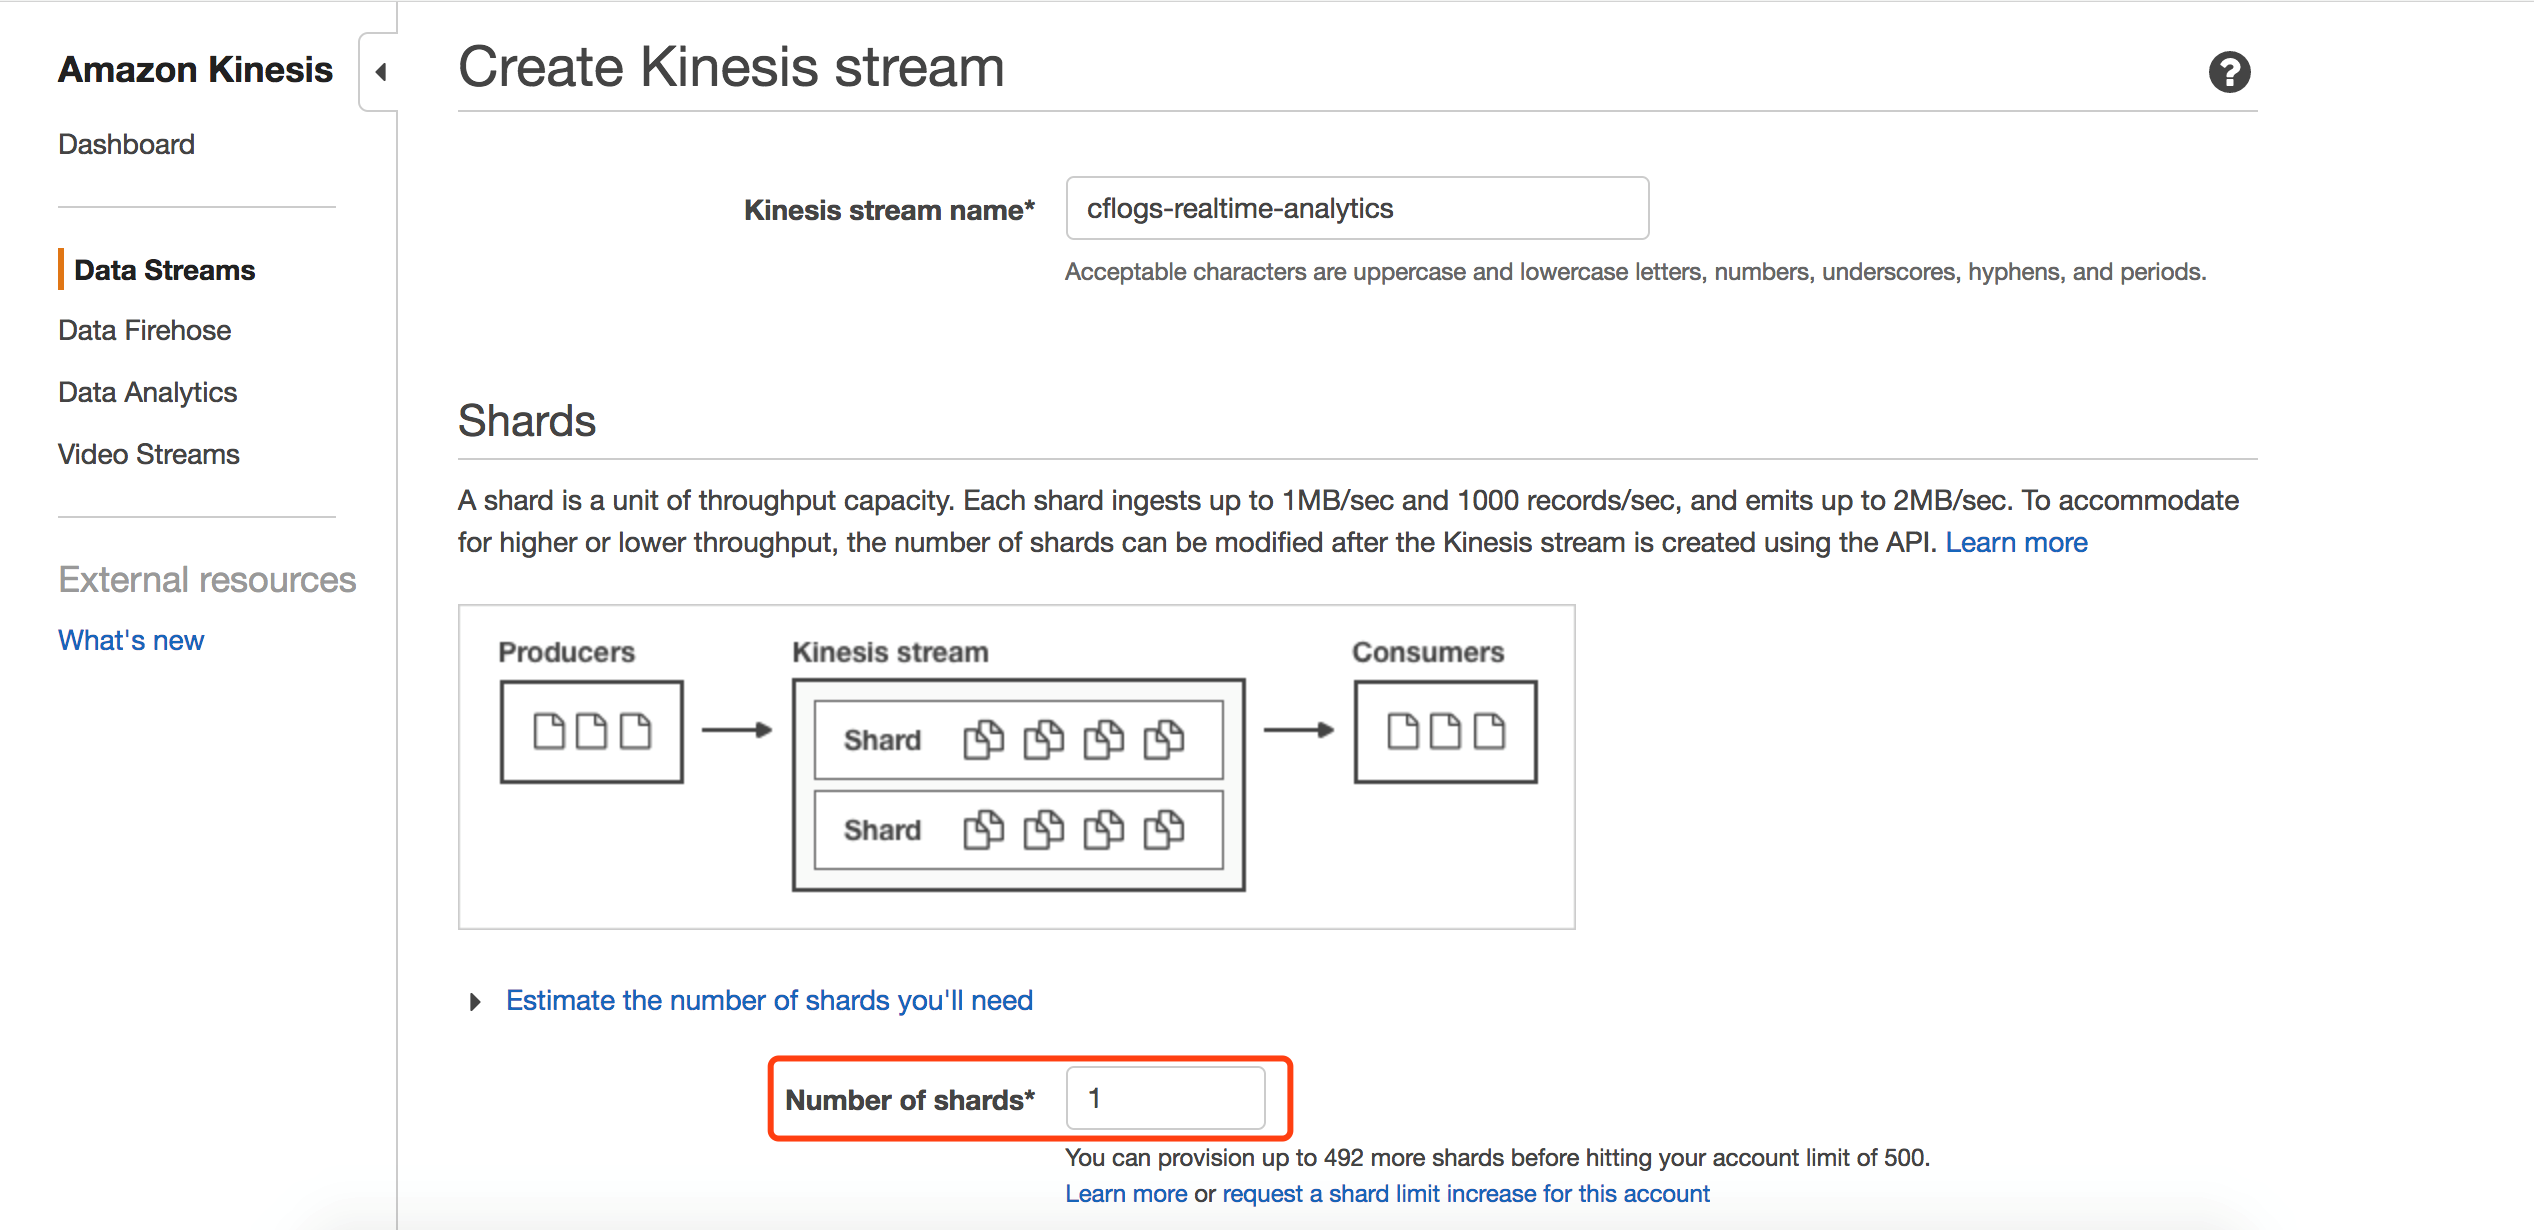
Create a Kinesis Stream to receive logs sent by Lambda.
Step 2: Push Data into the Kinesis Stream
Since CloudFront only generates logs when there is user traffic, and the log generation process is not real-time, we use a tool to simulate messages generated by Lambda being pushed into the Kinesis stream for testing purposes. You can view details of this tool at the following link. https://github.com/awslabs/amazon-kinesis-data-generator
Kinesis Data Generator allows you to quickly generate test traffic and push it into a specified Kinesis stream through simple configuration in a PC browser. It also supports generating random data. In the figure below, we push data into the Kinesis stream in the us-east-1 region at a rate of one message per second. The data format simulates the output of the Lambda function, i.e., each field of the CloudFront log is output in JSON format. Additionally, the c_ip (client IP) field is configured so that the tool generates one of four IP addresses with a certain probability. Other fields are fixed. Test data can be obtained by letting CloudFront generate logs and then outputting them in the Lambda function, or downloaded from the following link:
https://github.com/iwasnobody/cflogs2analytics2ddb/blob/master/KinesisDataGenerator
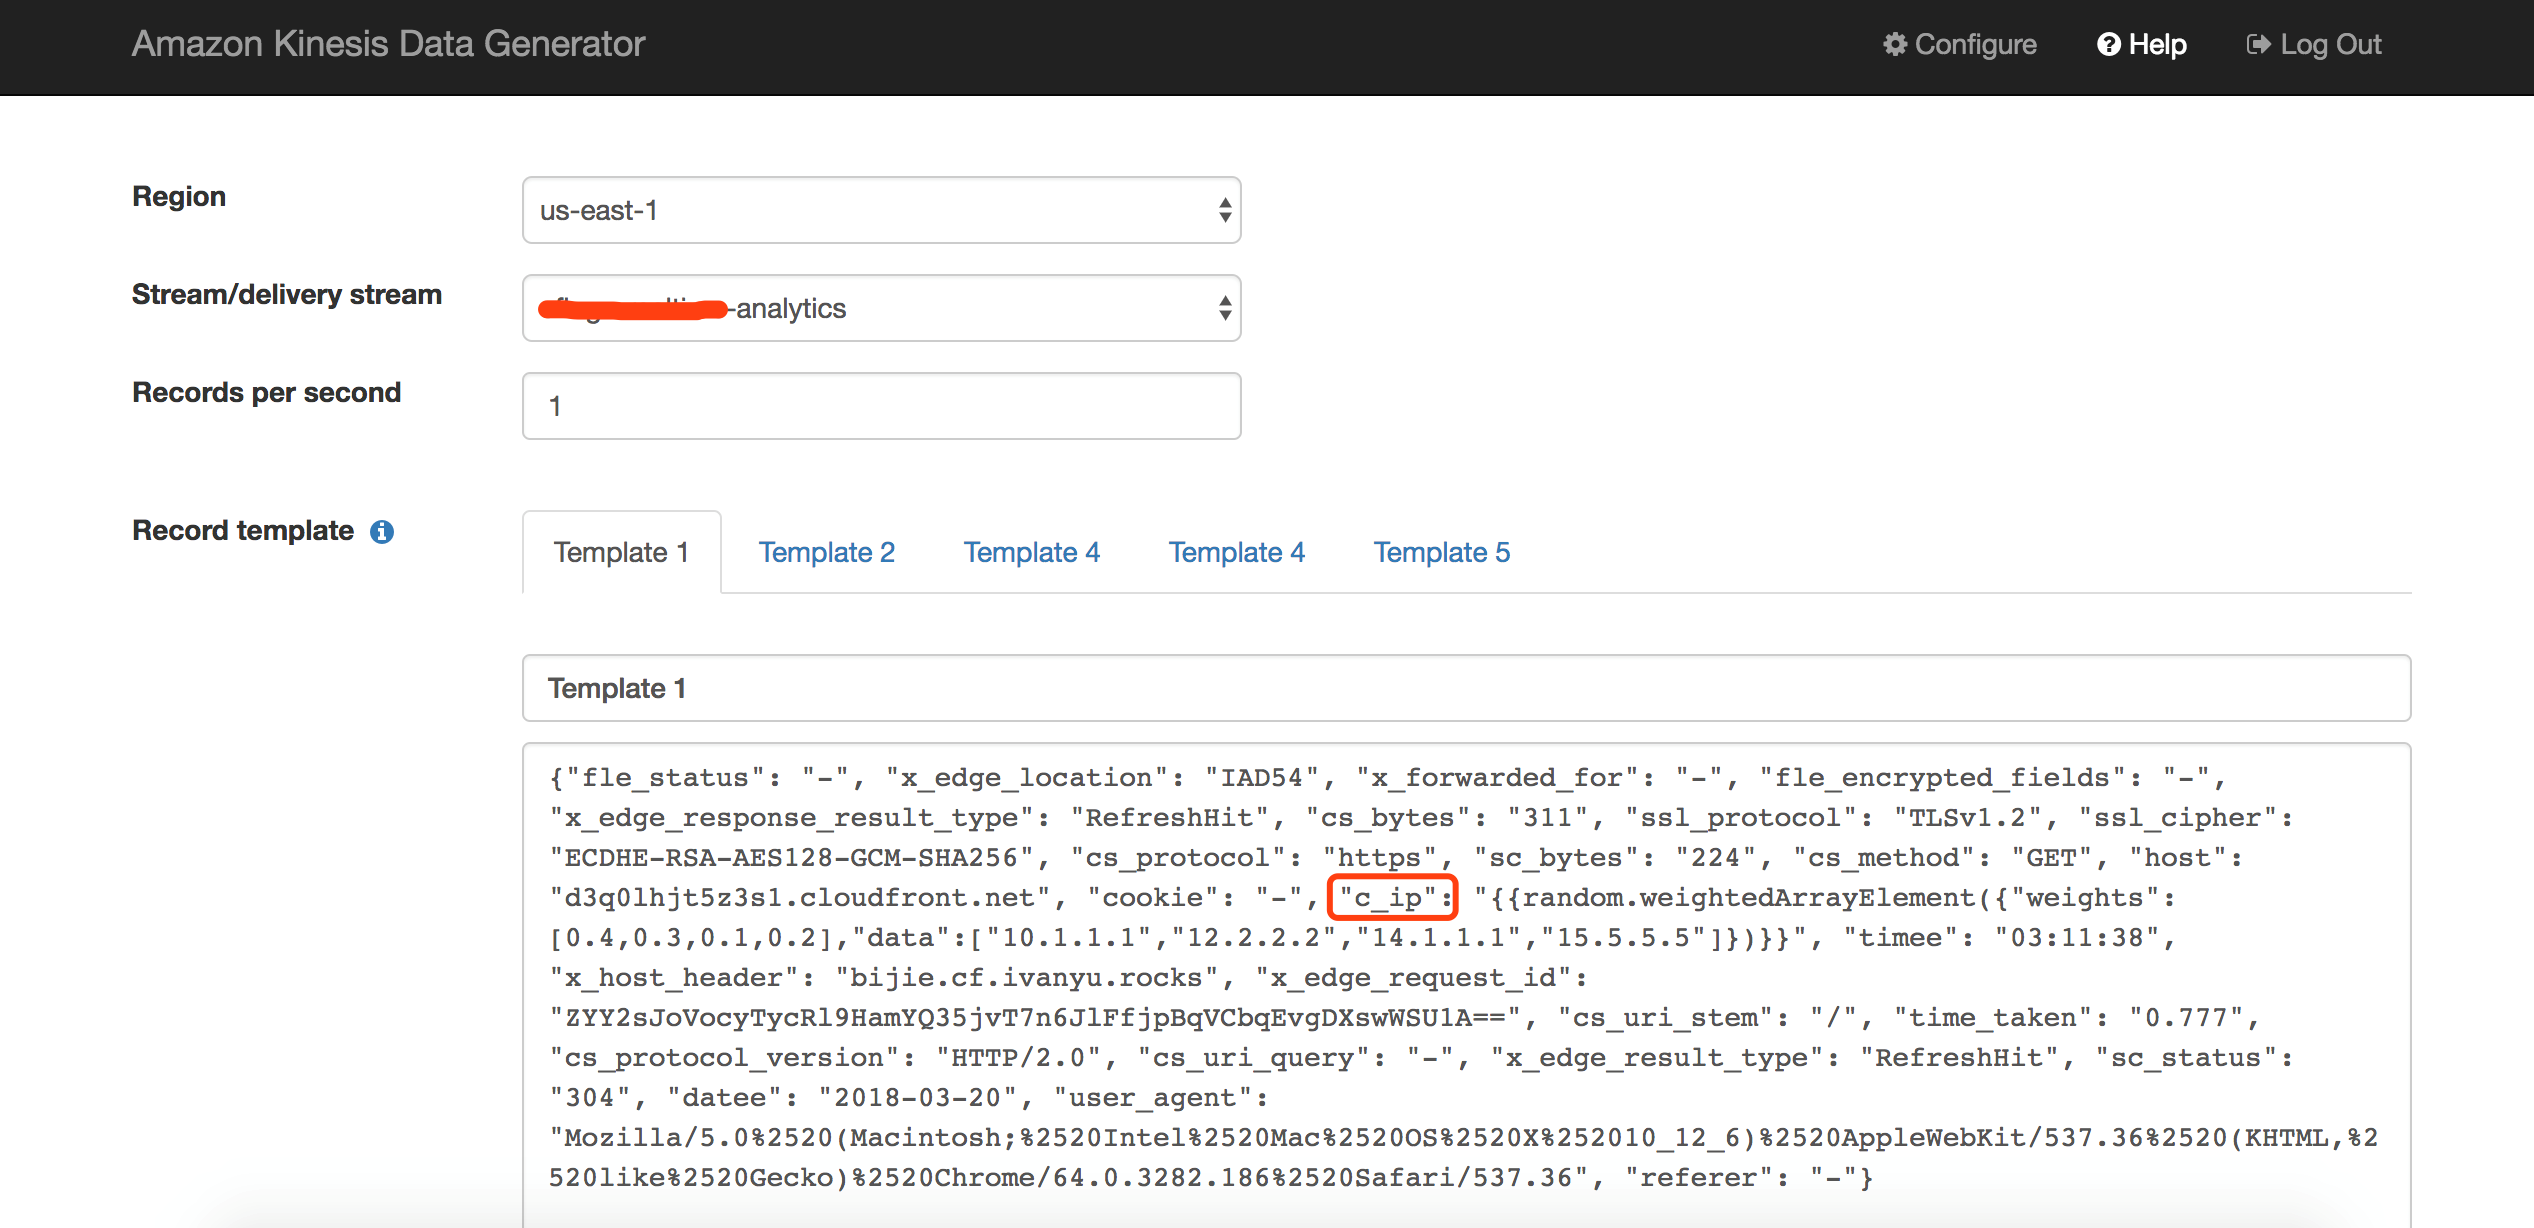
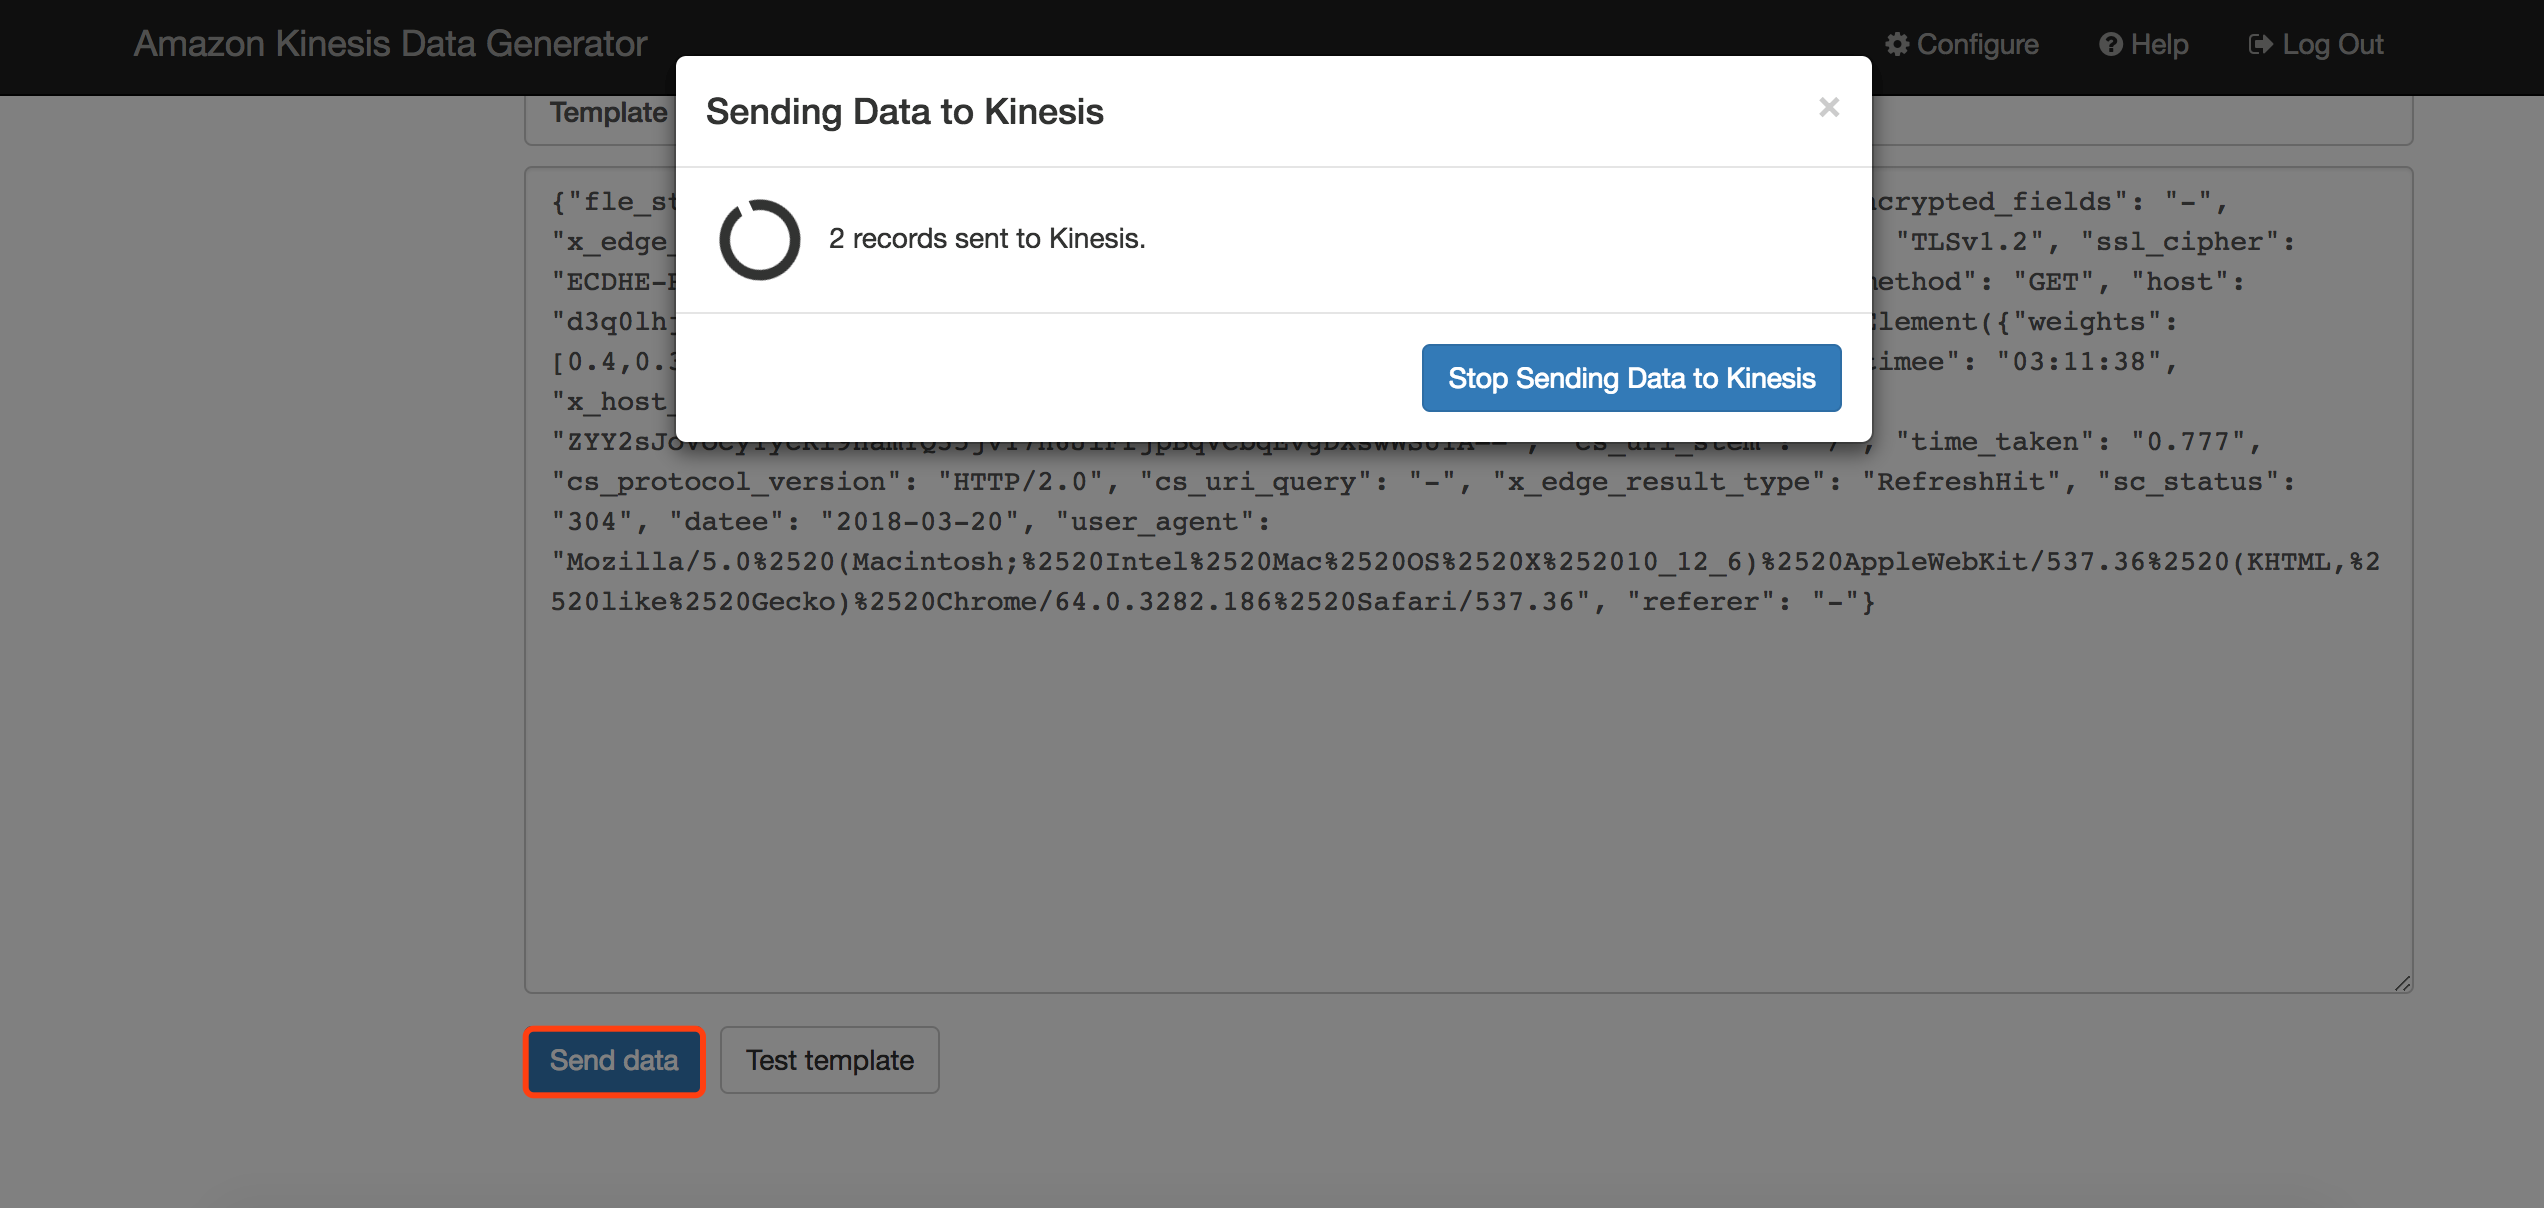
Click “Send Data” to start pushing data into the Kinesis stream.
Step 3: Create Kinesis Analytics for Real-Time Analysis of Data in the Kinesis Stream
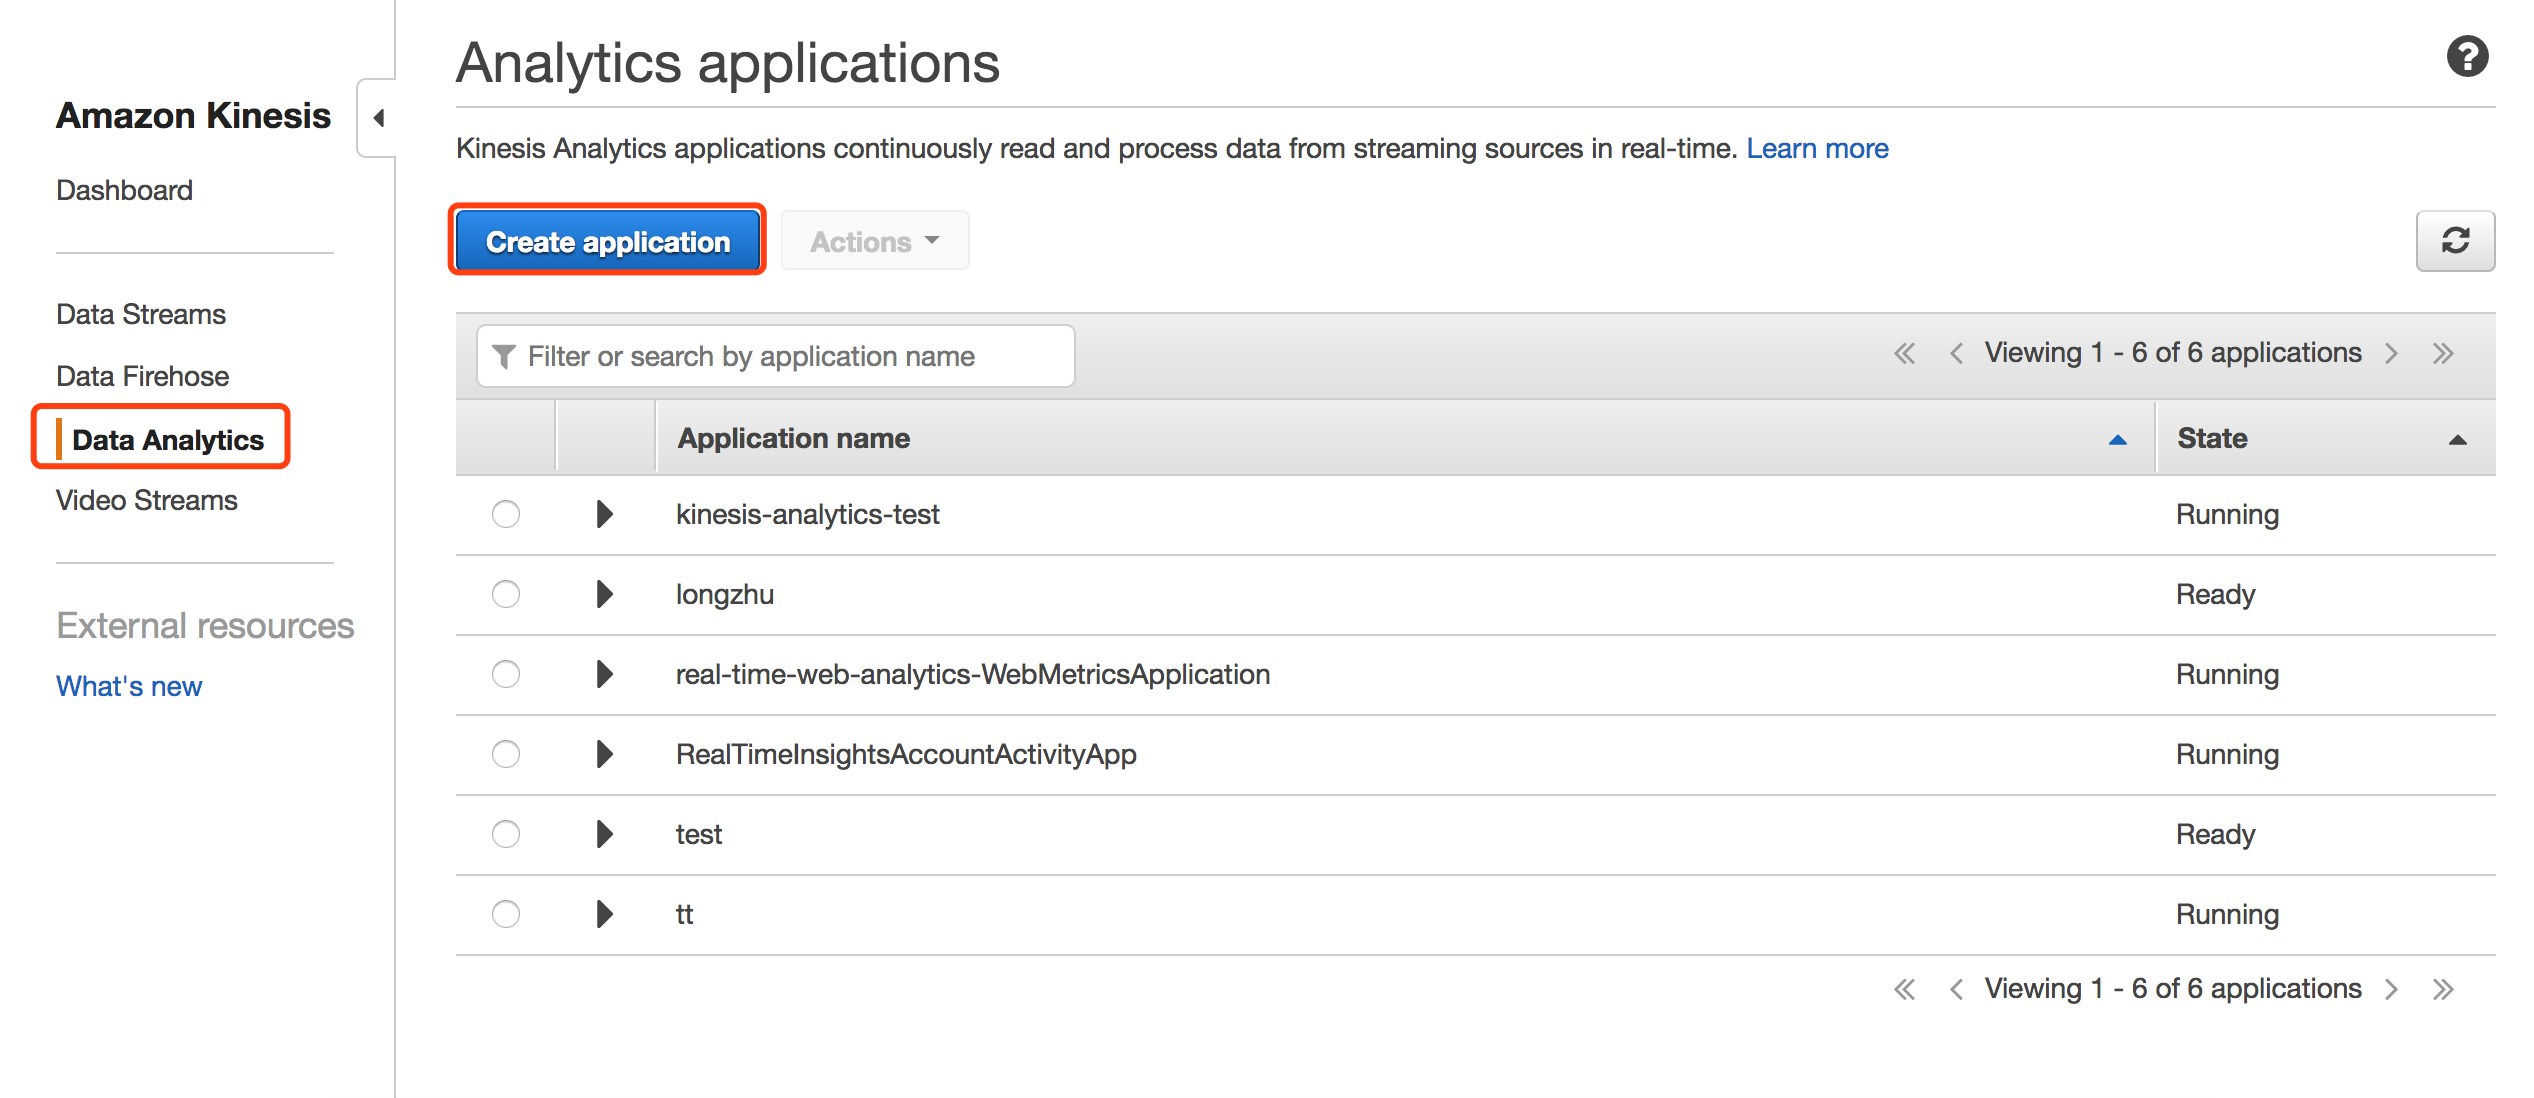
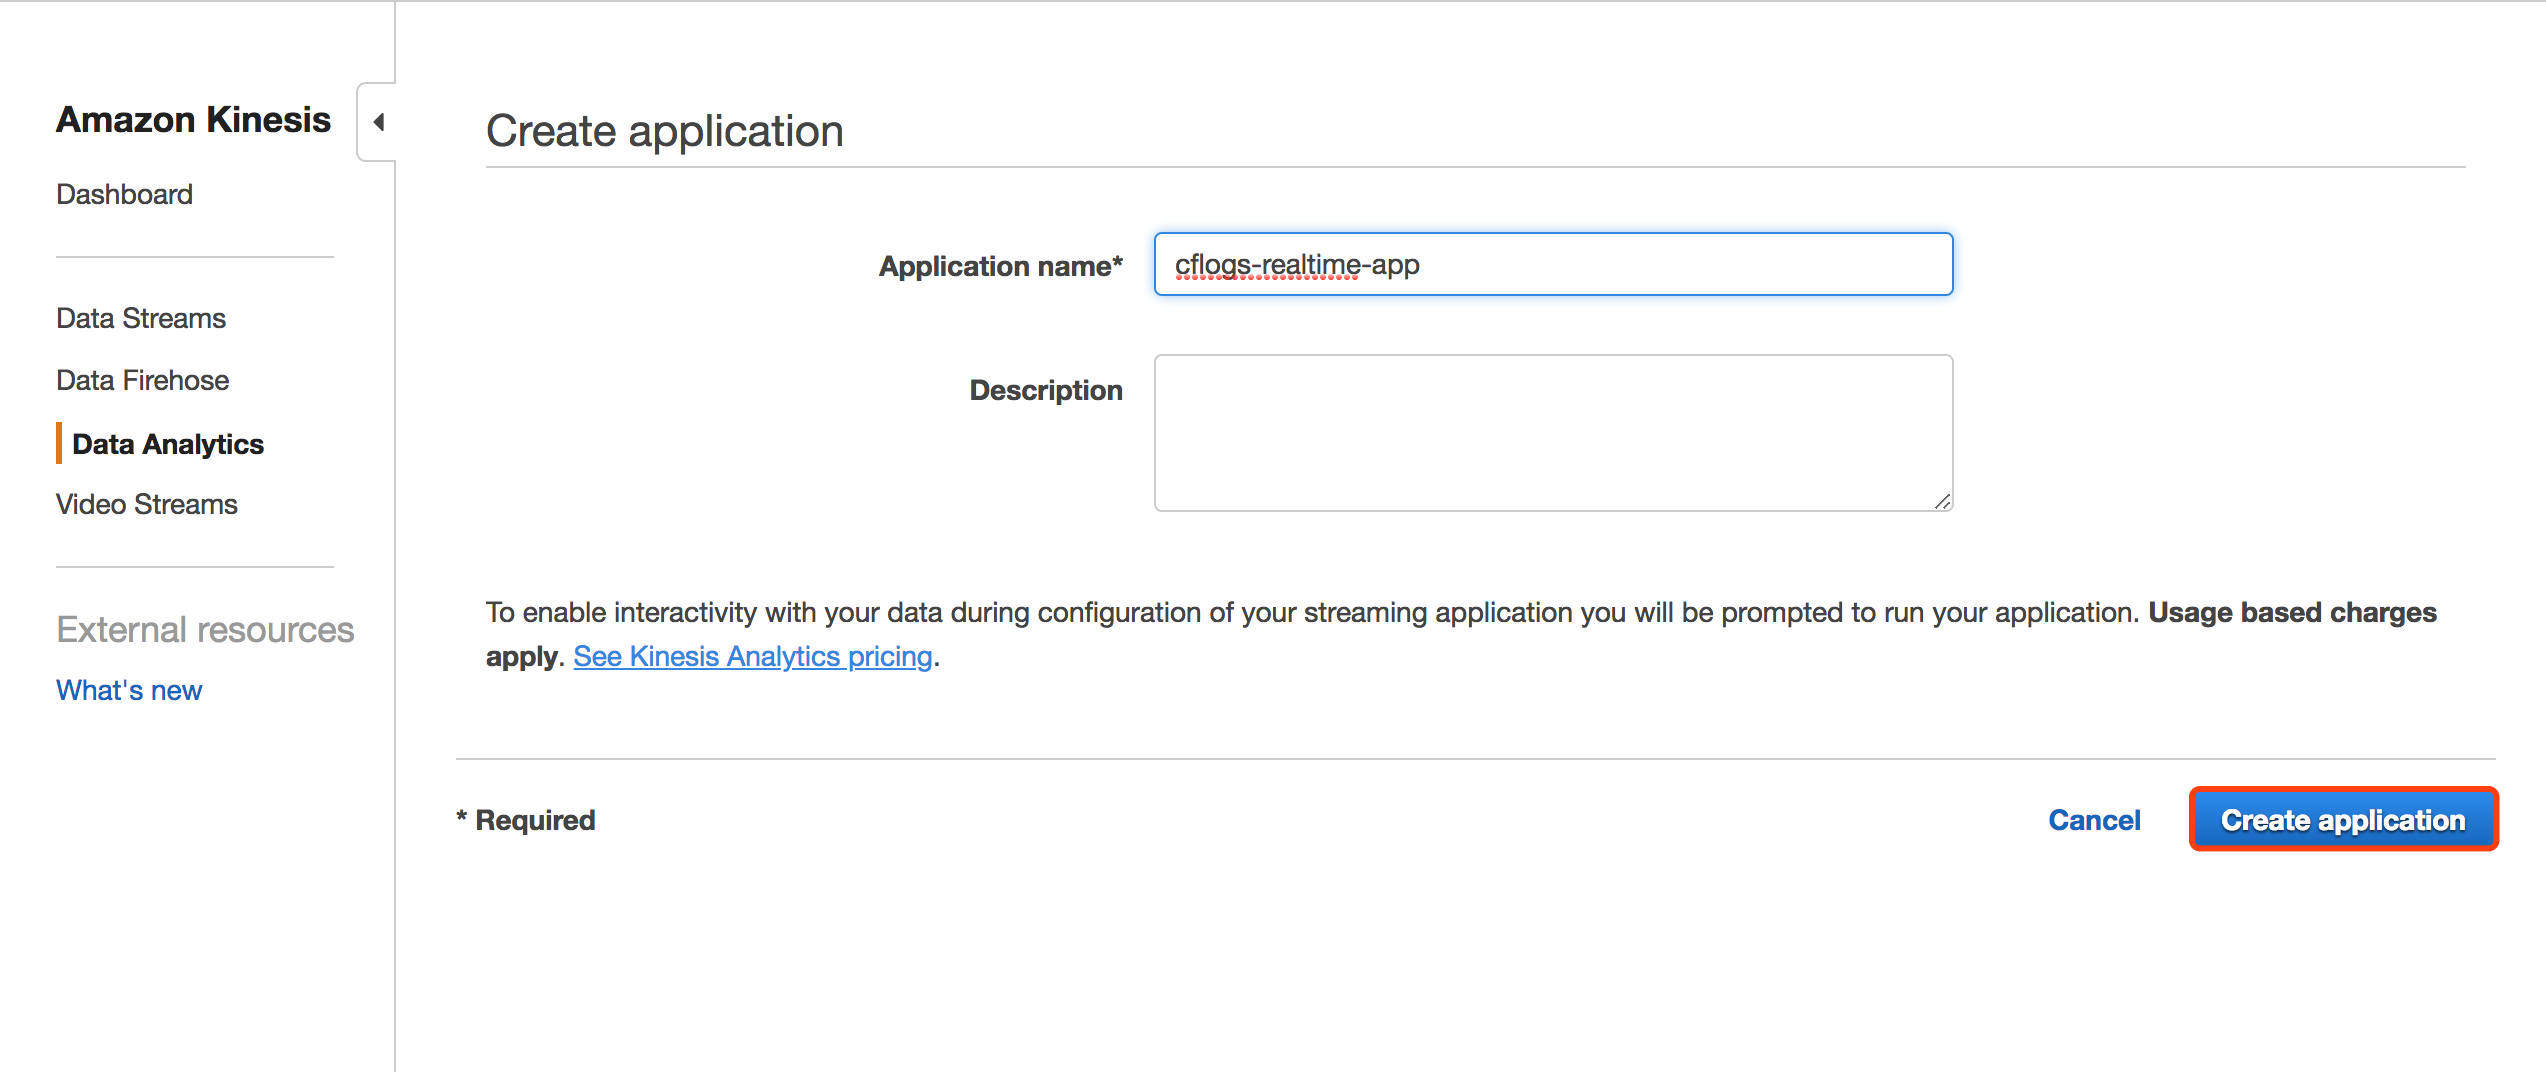
First, create a Data Analytics application.
Set the data source connected to the application to the previously created Kinesis stream.
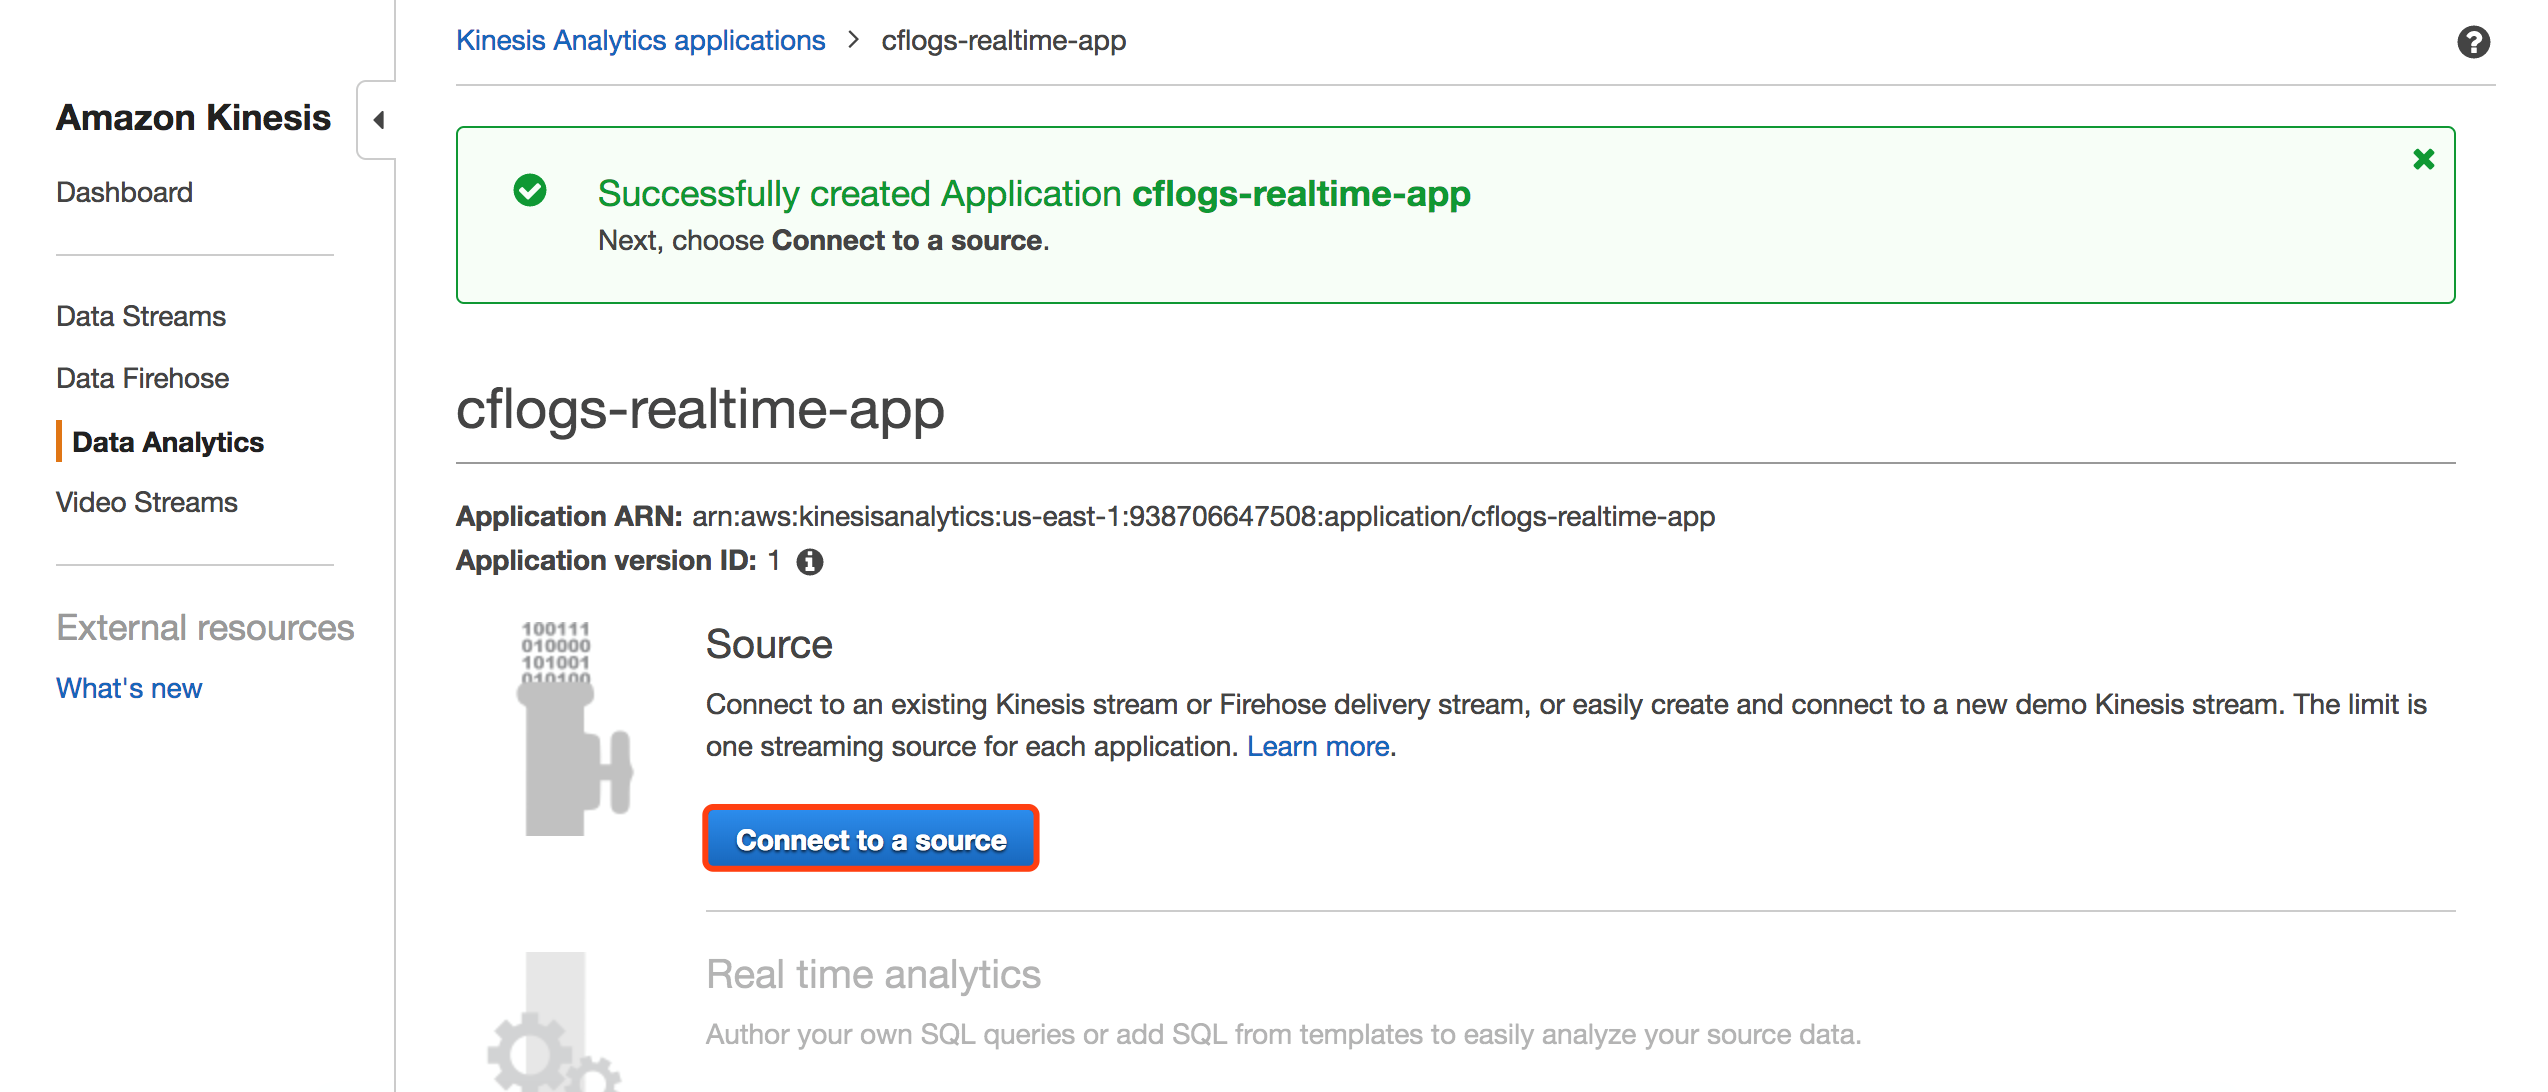
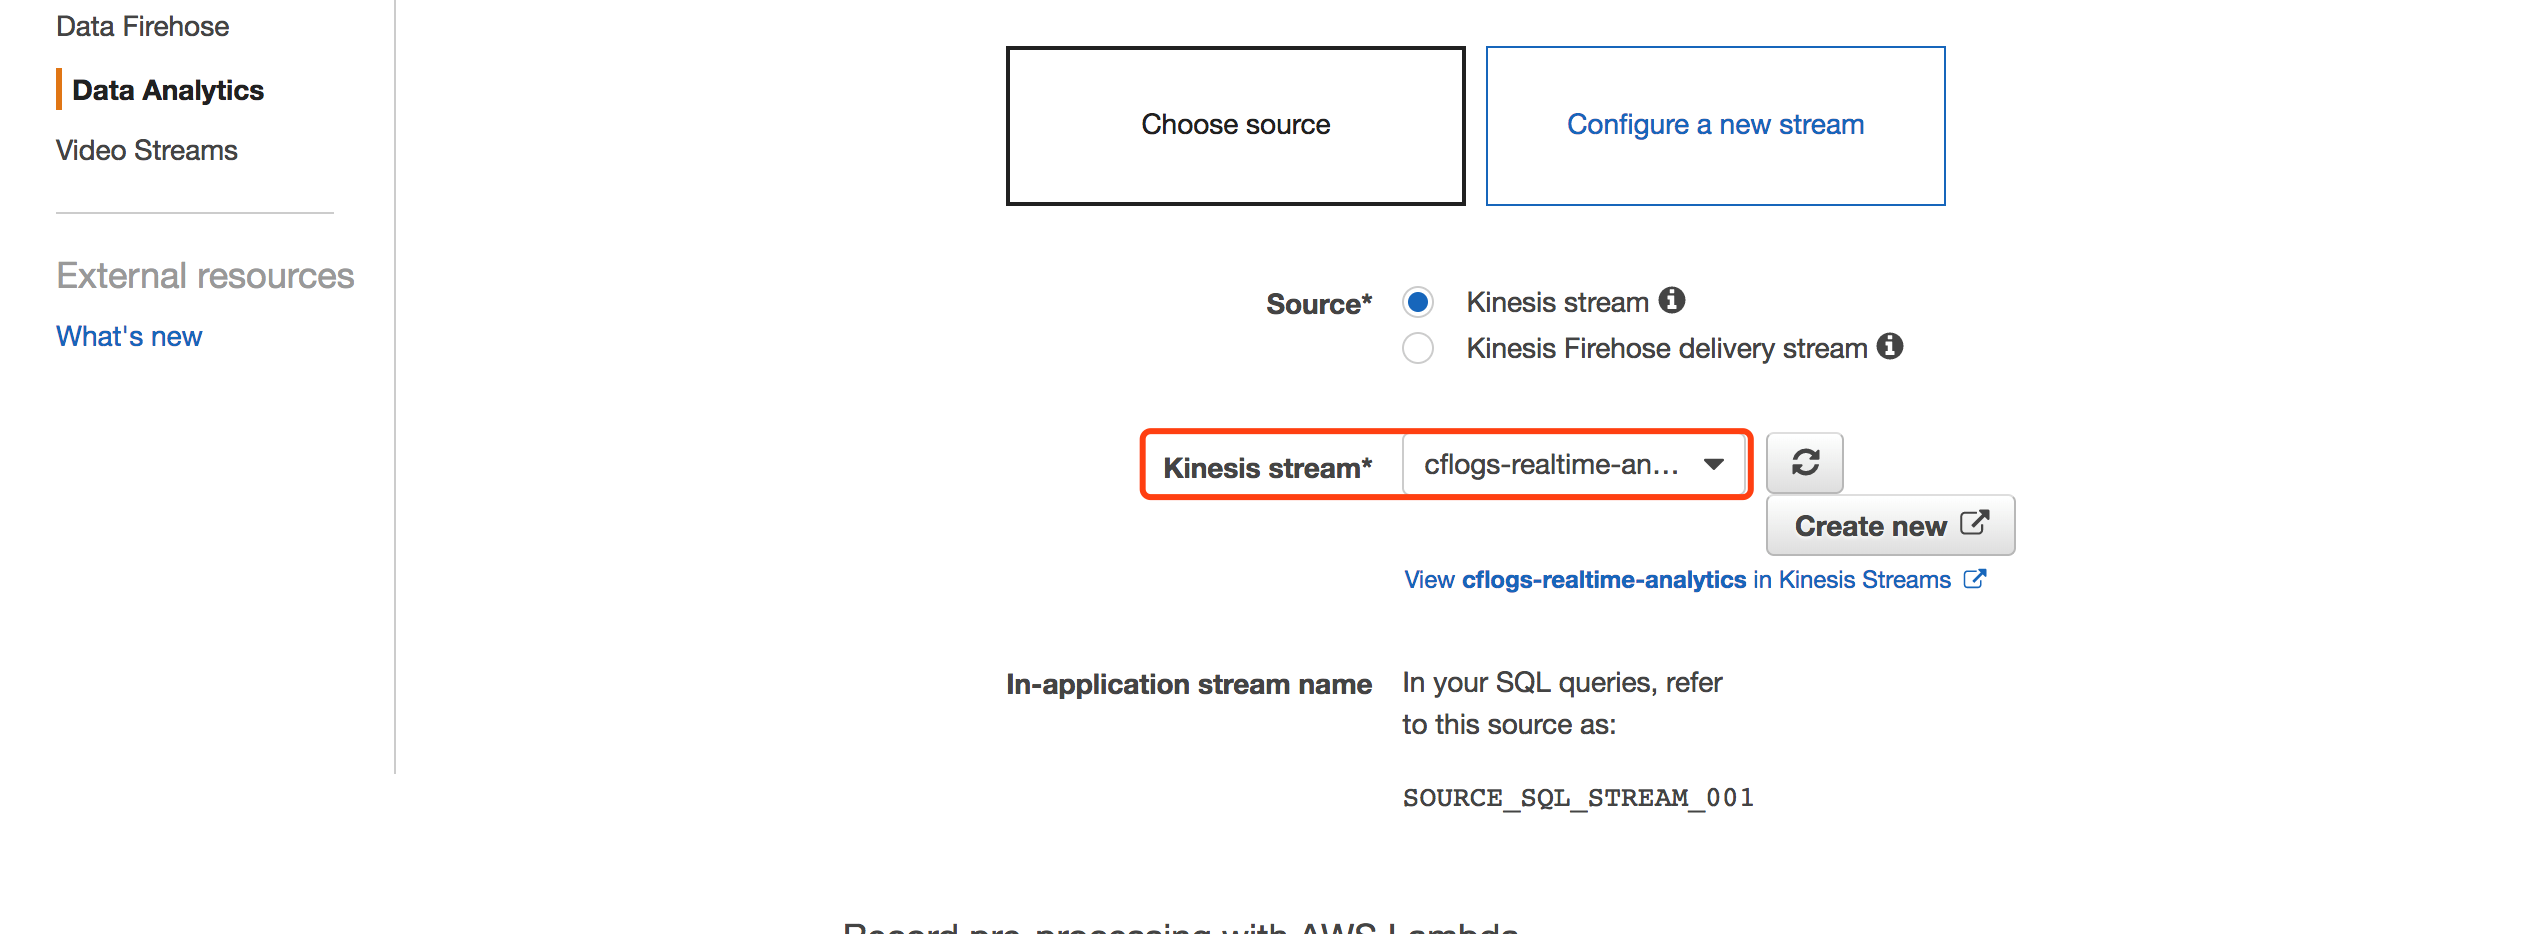
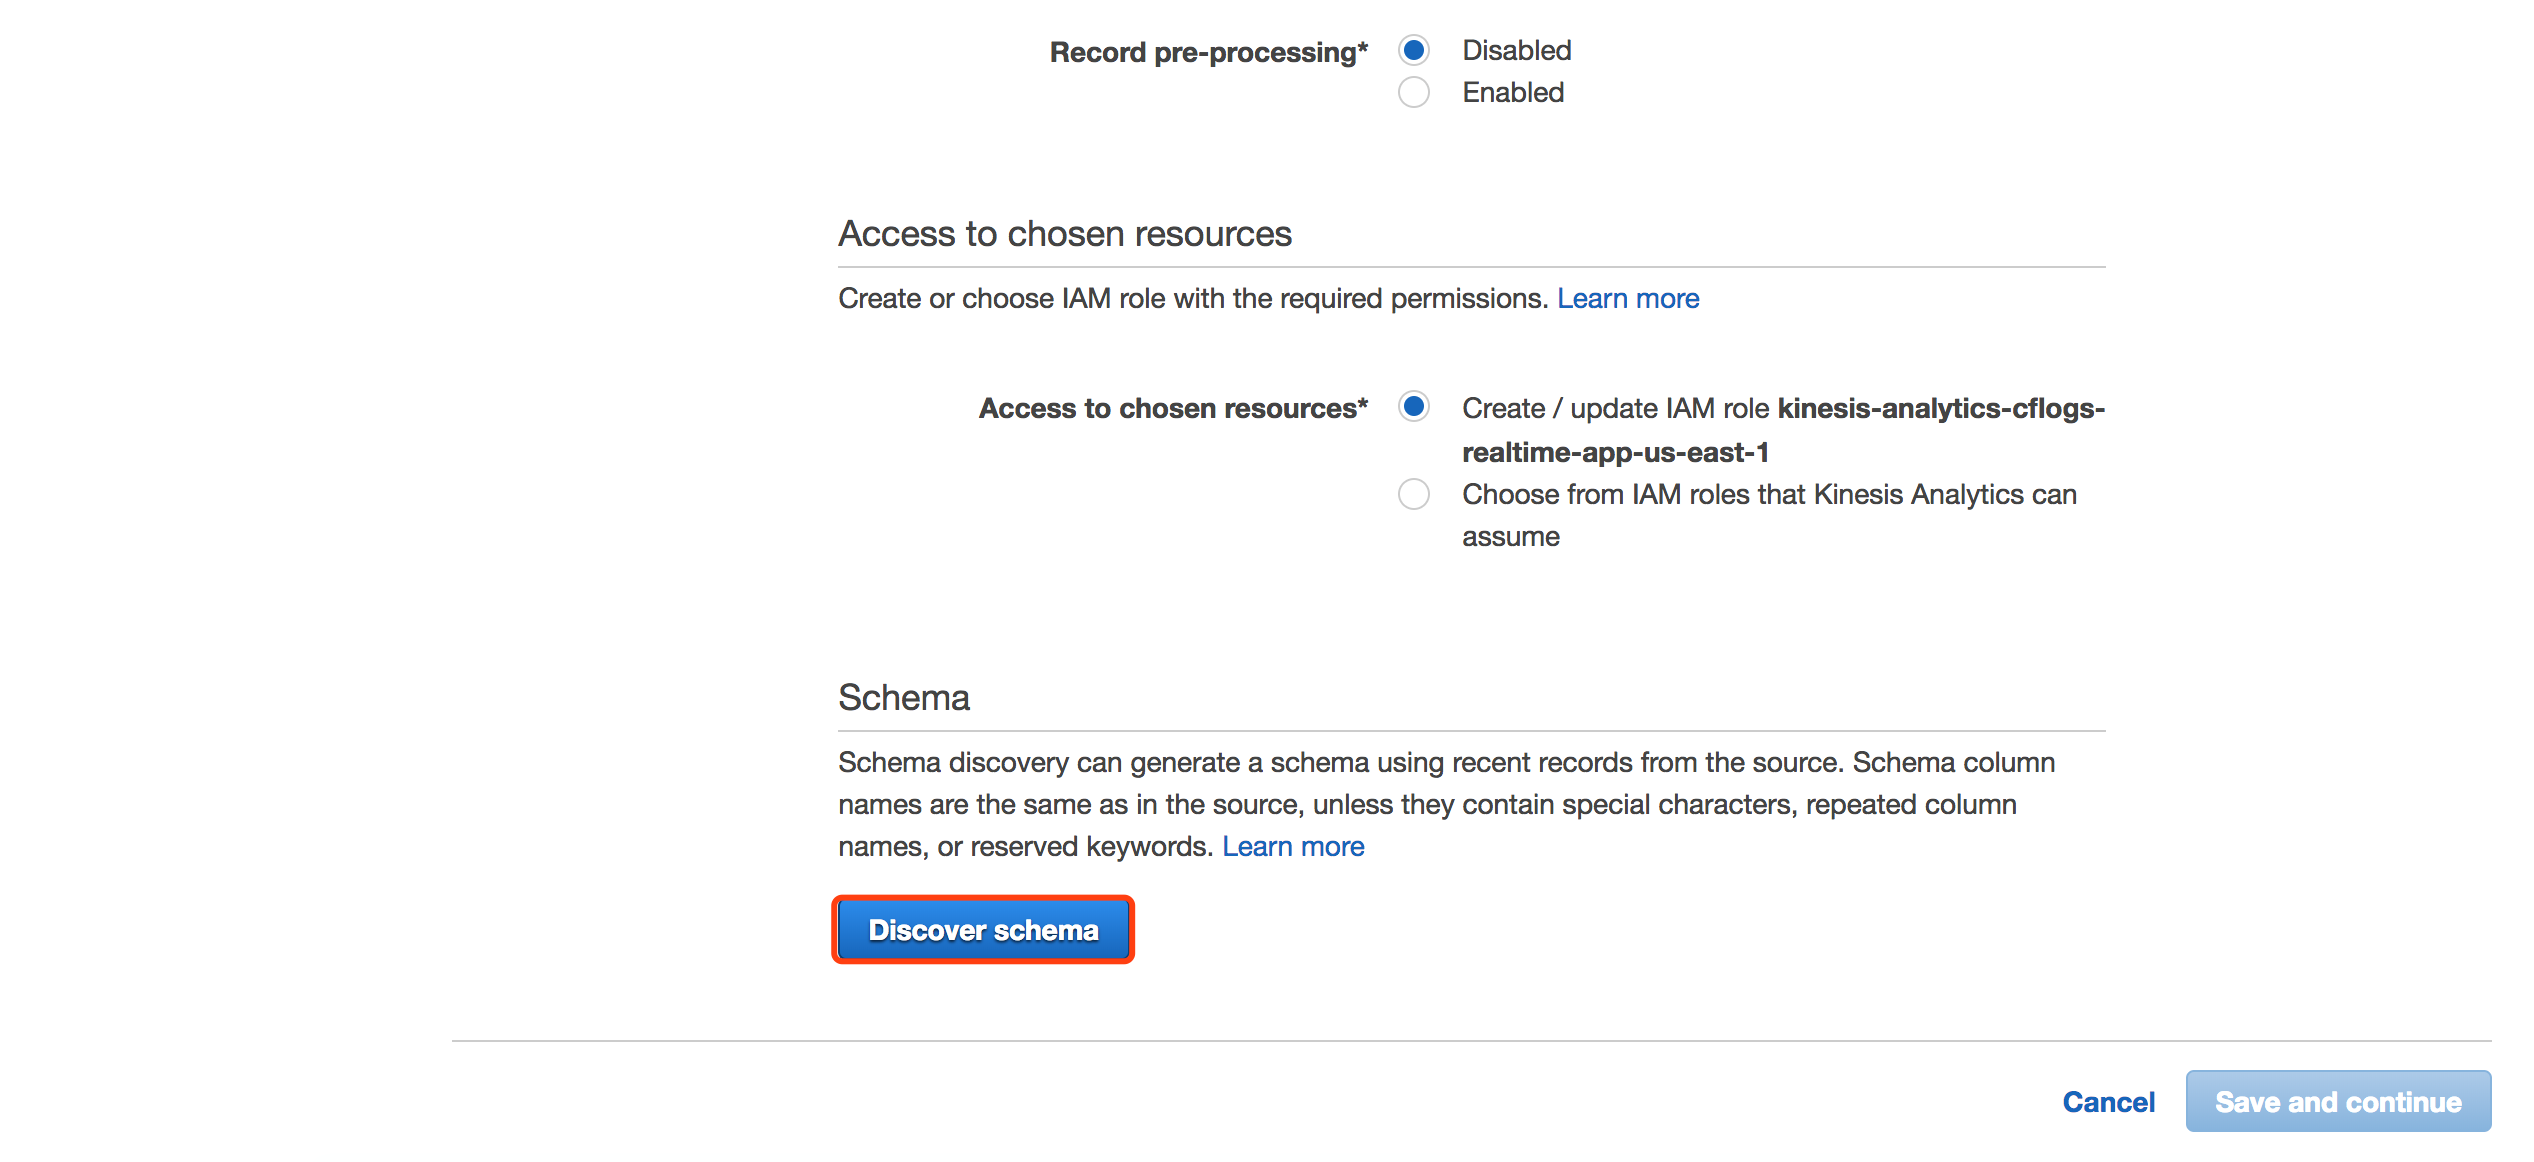
Click “Discover Schema” to let Analytics automatically discover the schema of existing data in the Kinesis stream.
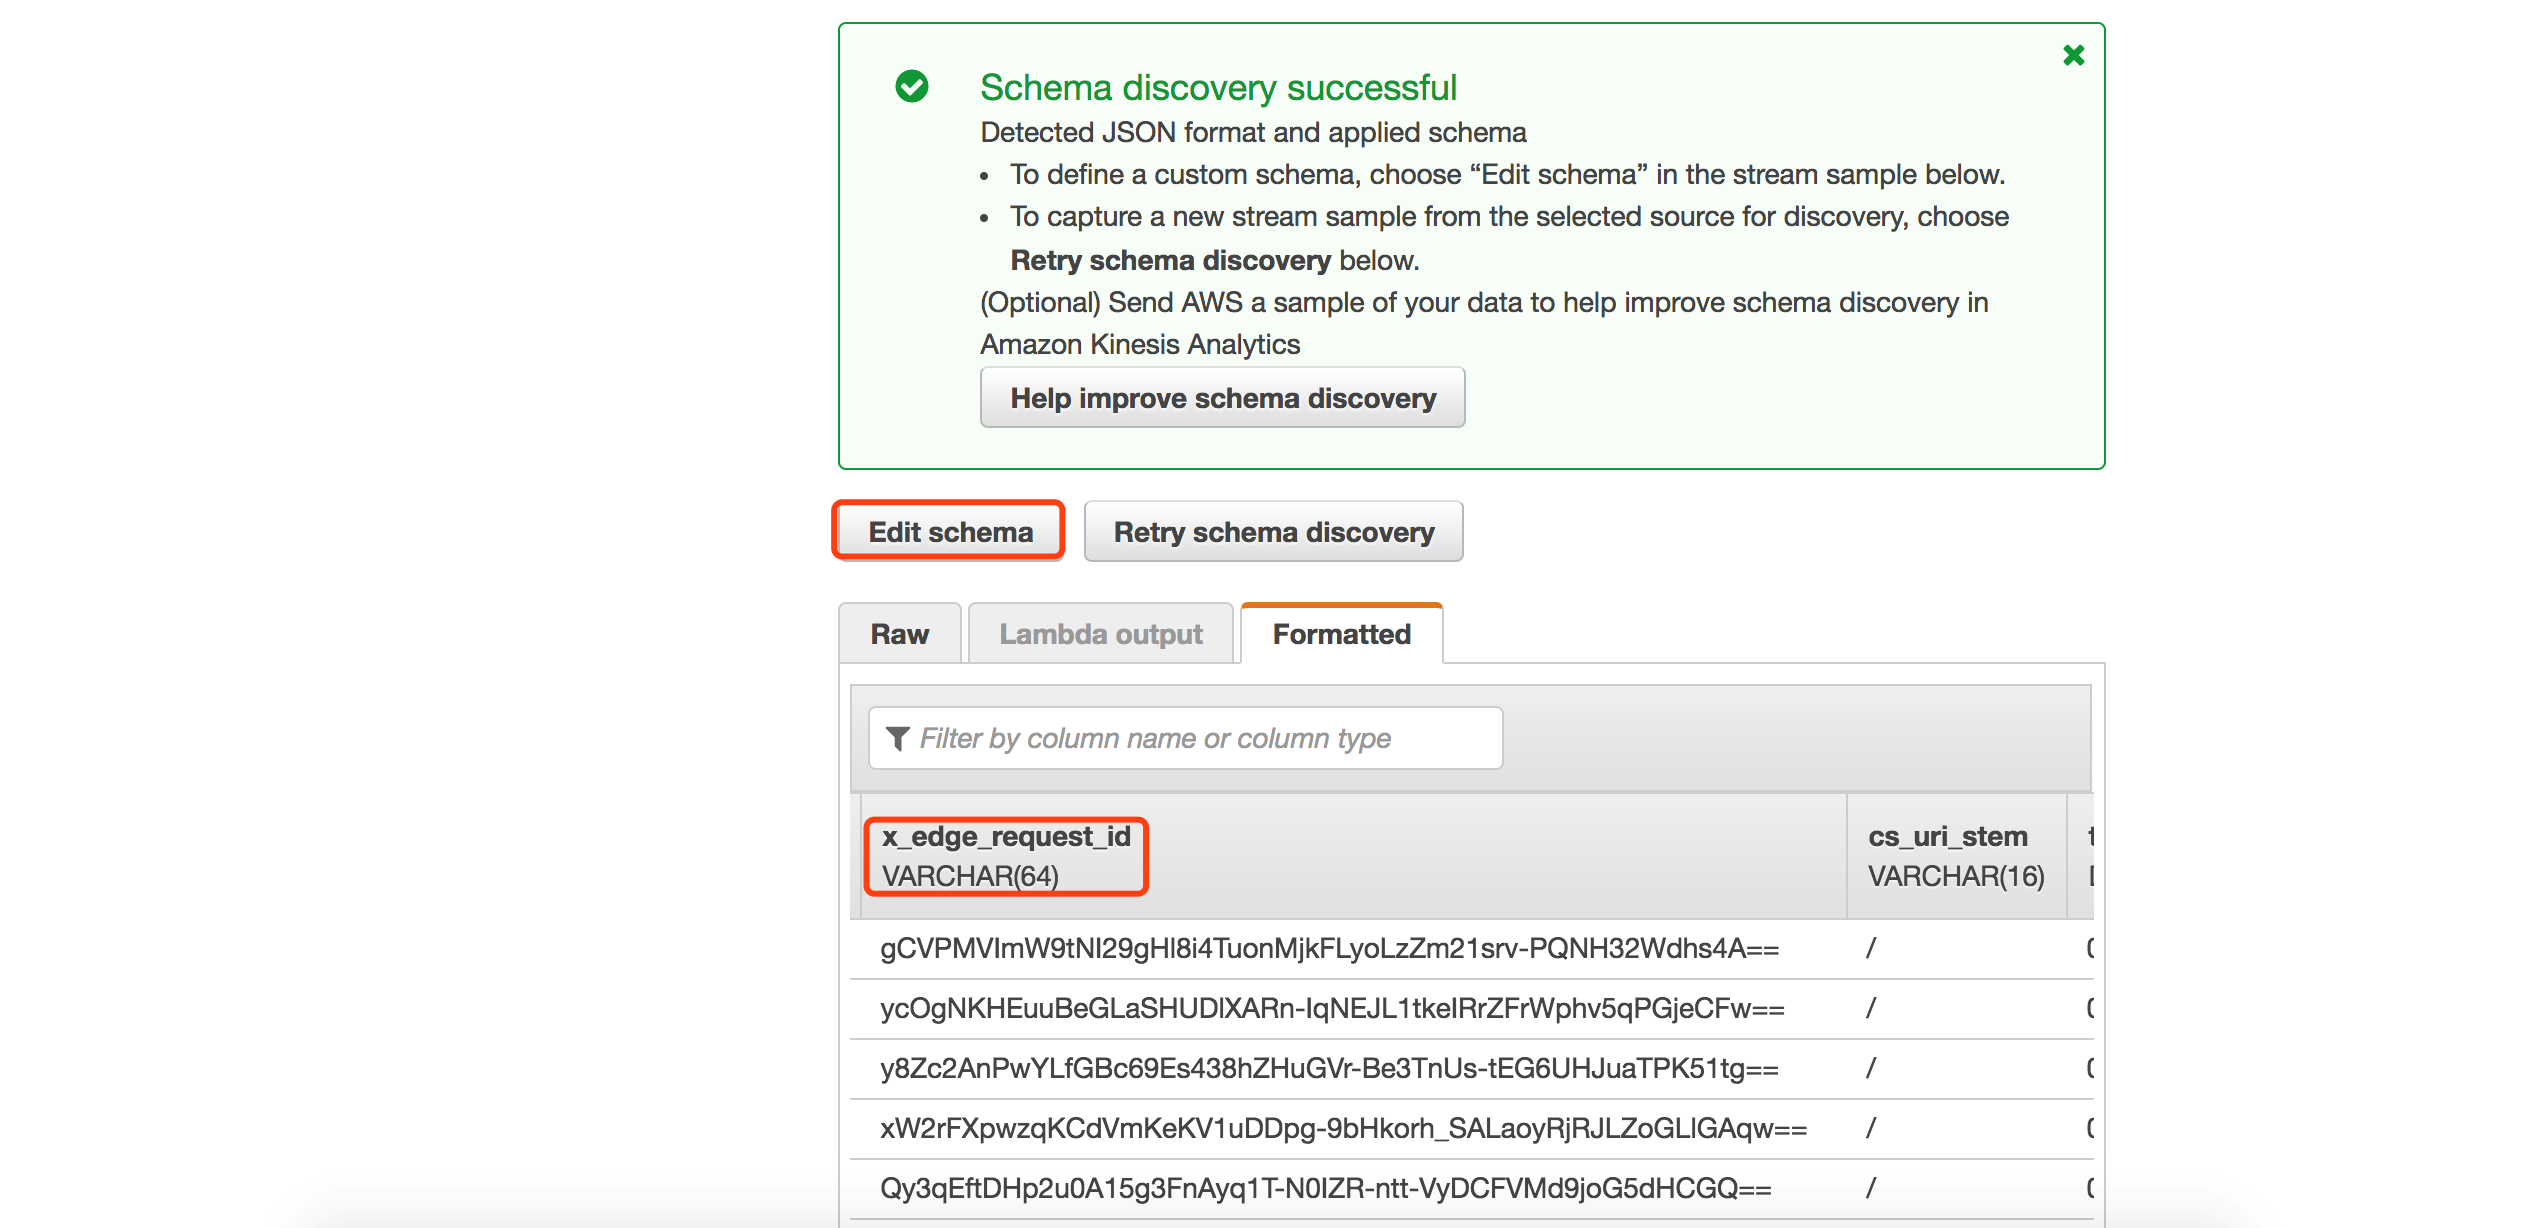
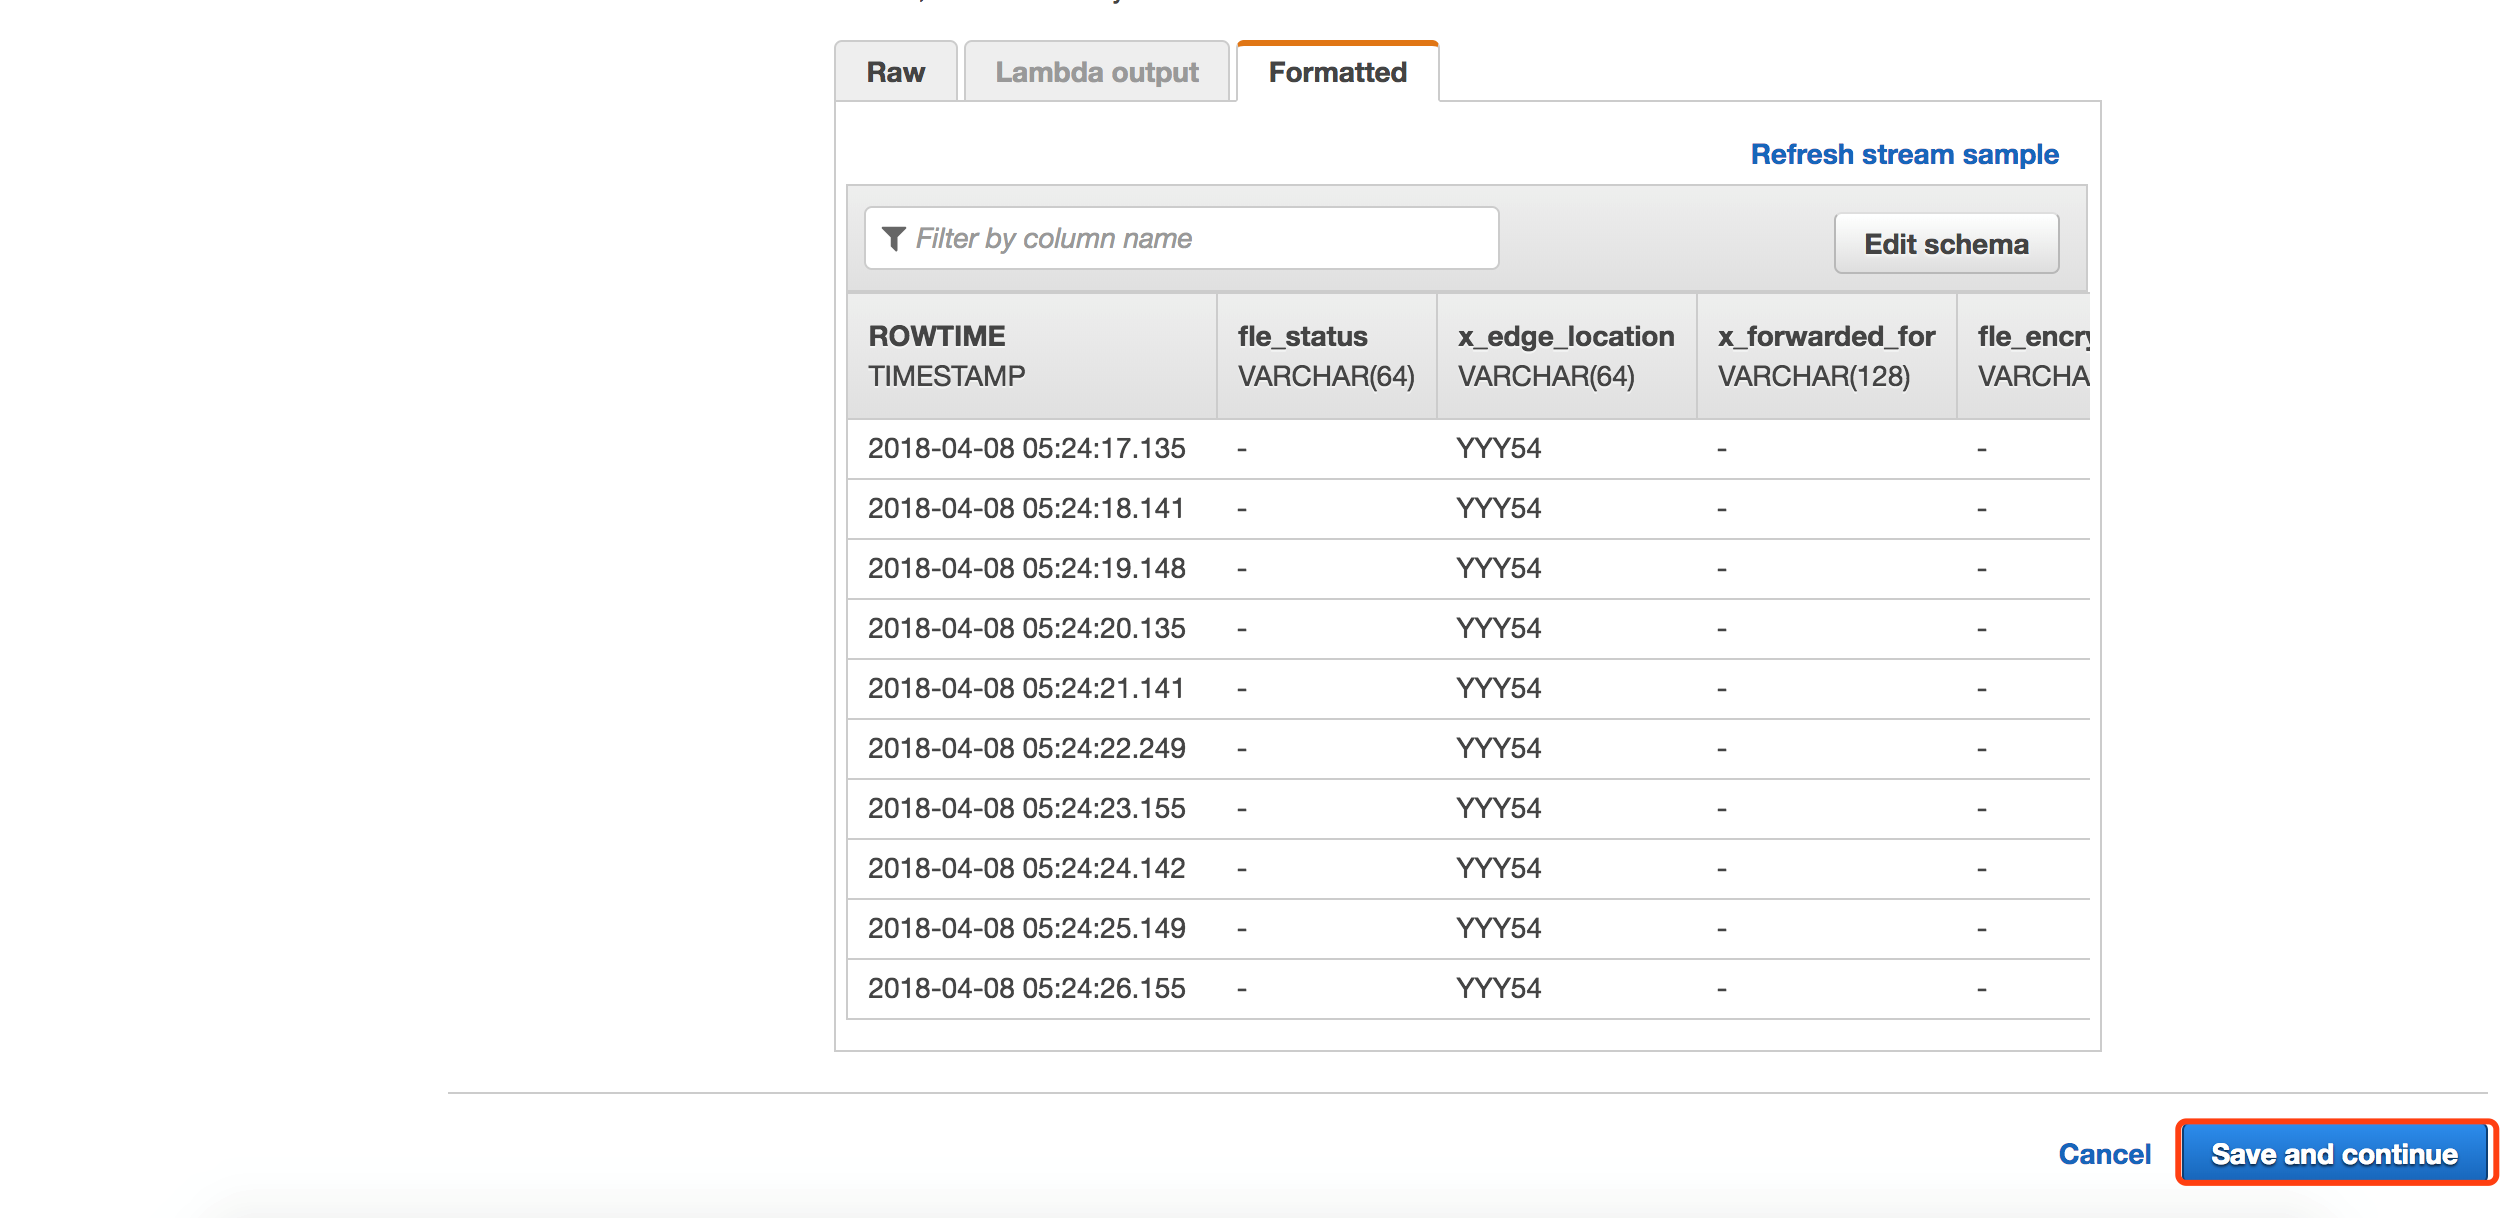
You can see that Analytics can automatically identify JSON-formatted CloudFront logs. However, since most of the log data we pushed consists of fixed fields, the automatically identified schema may not be accurate. For example, for the x_edge_request_id field, varchar(64) might be too small. We click to modify the schema.
Adjust the schema as follows:
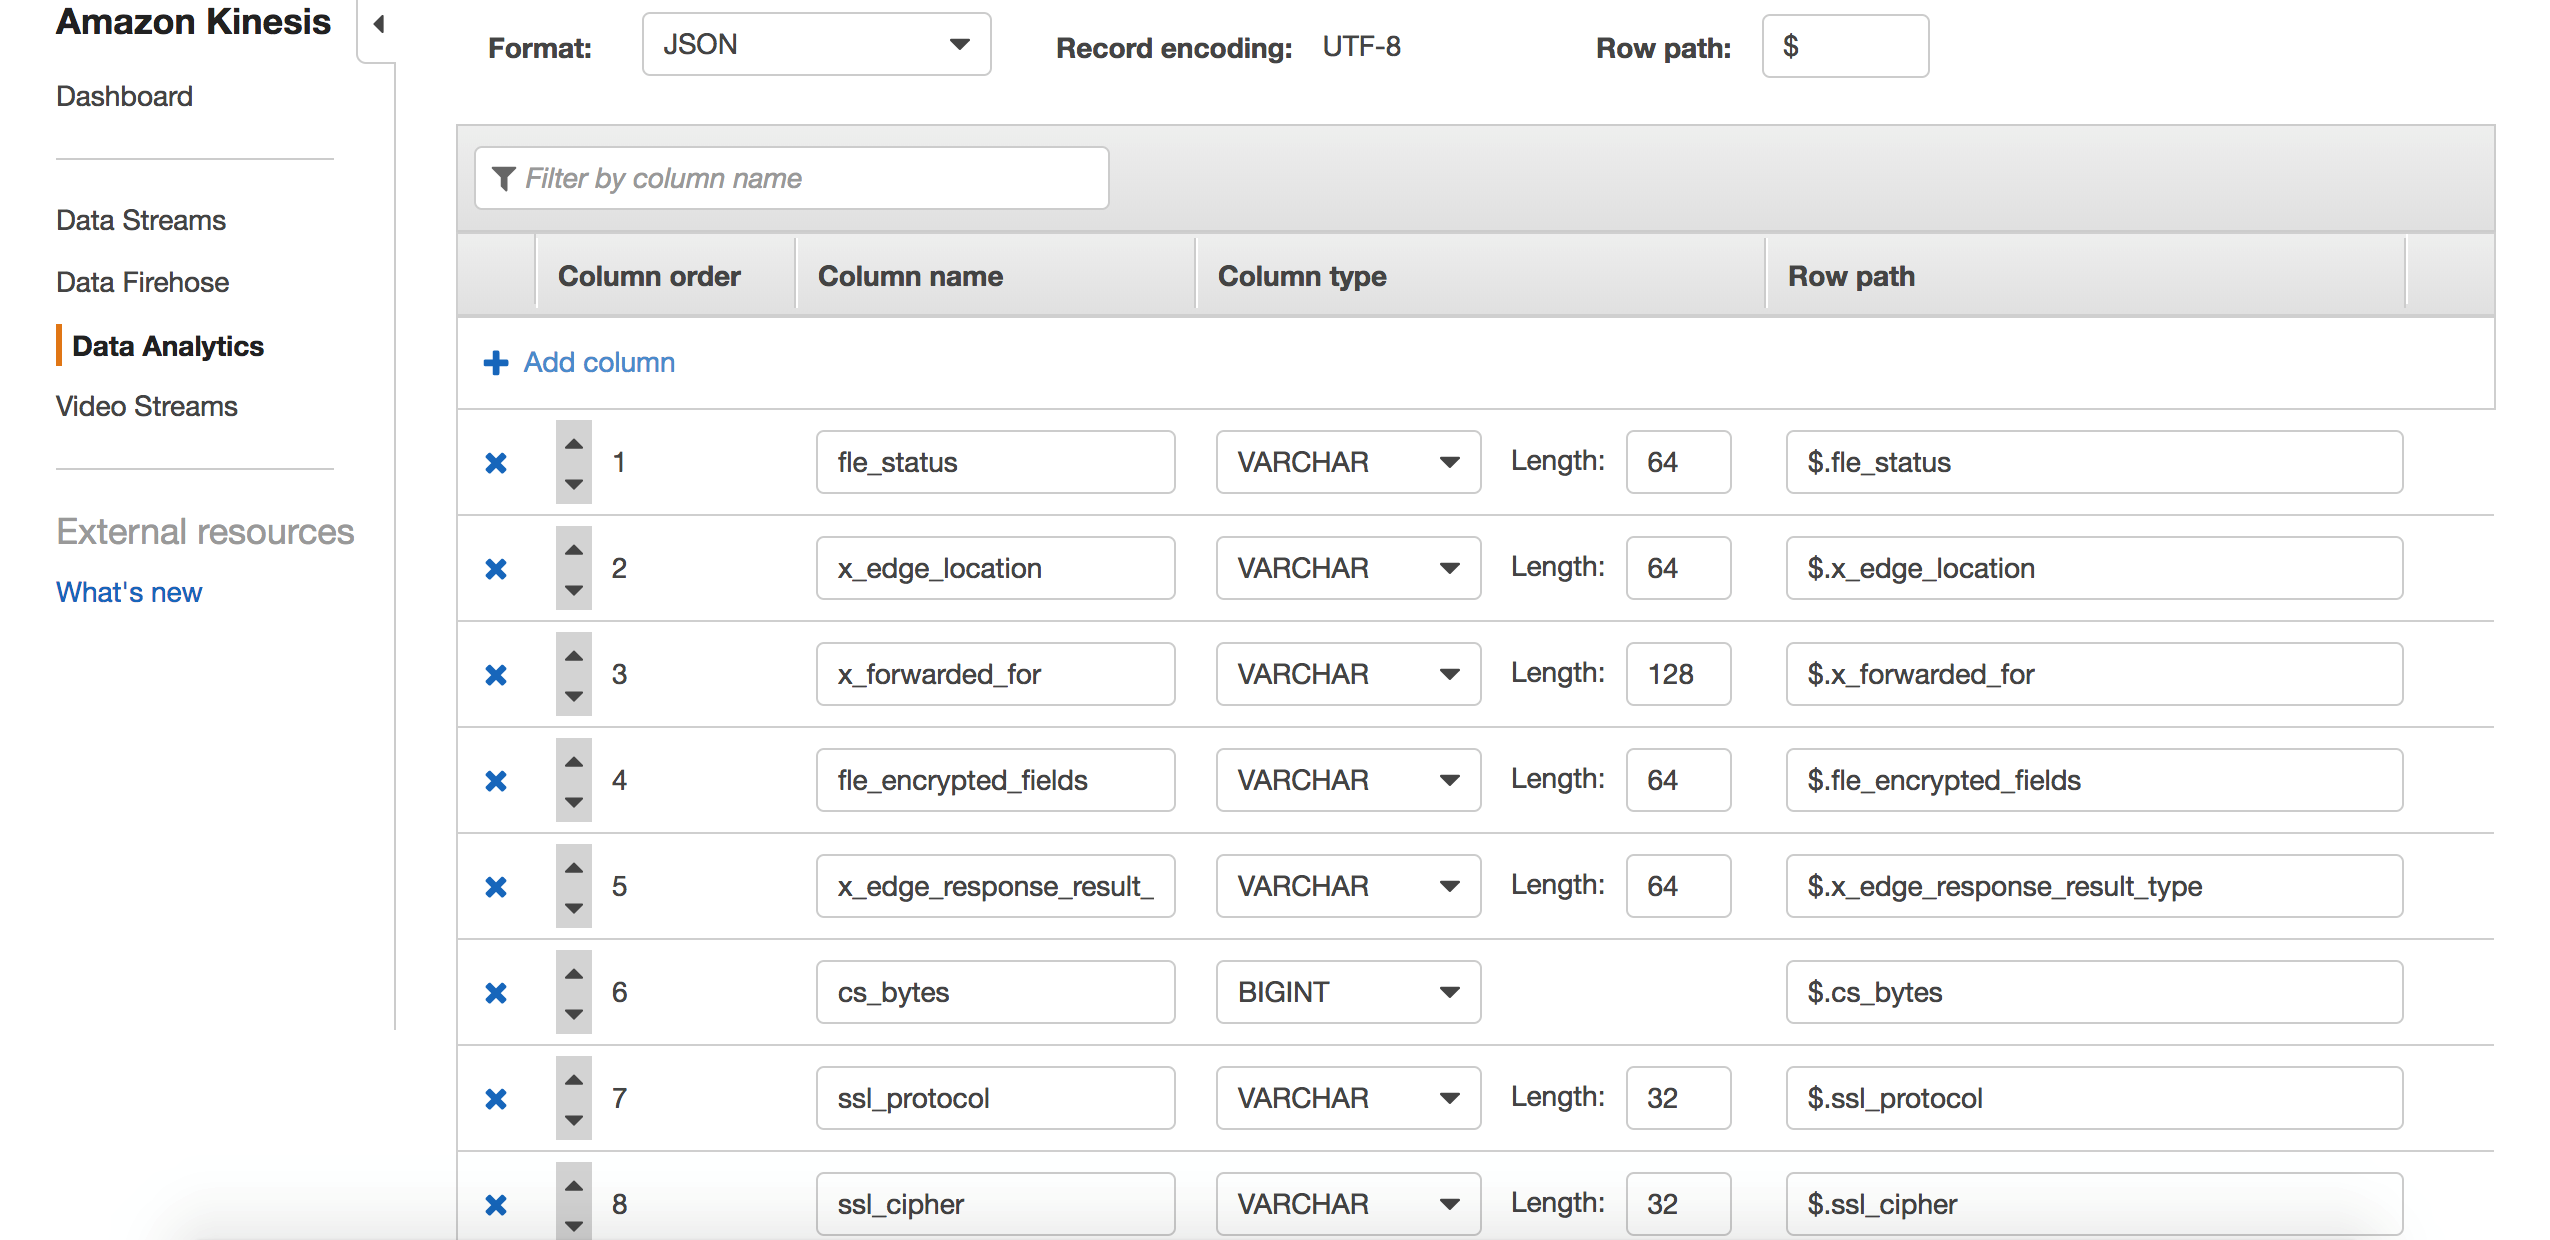
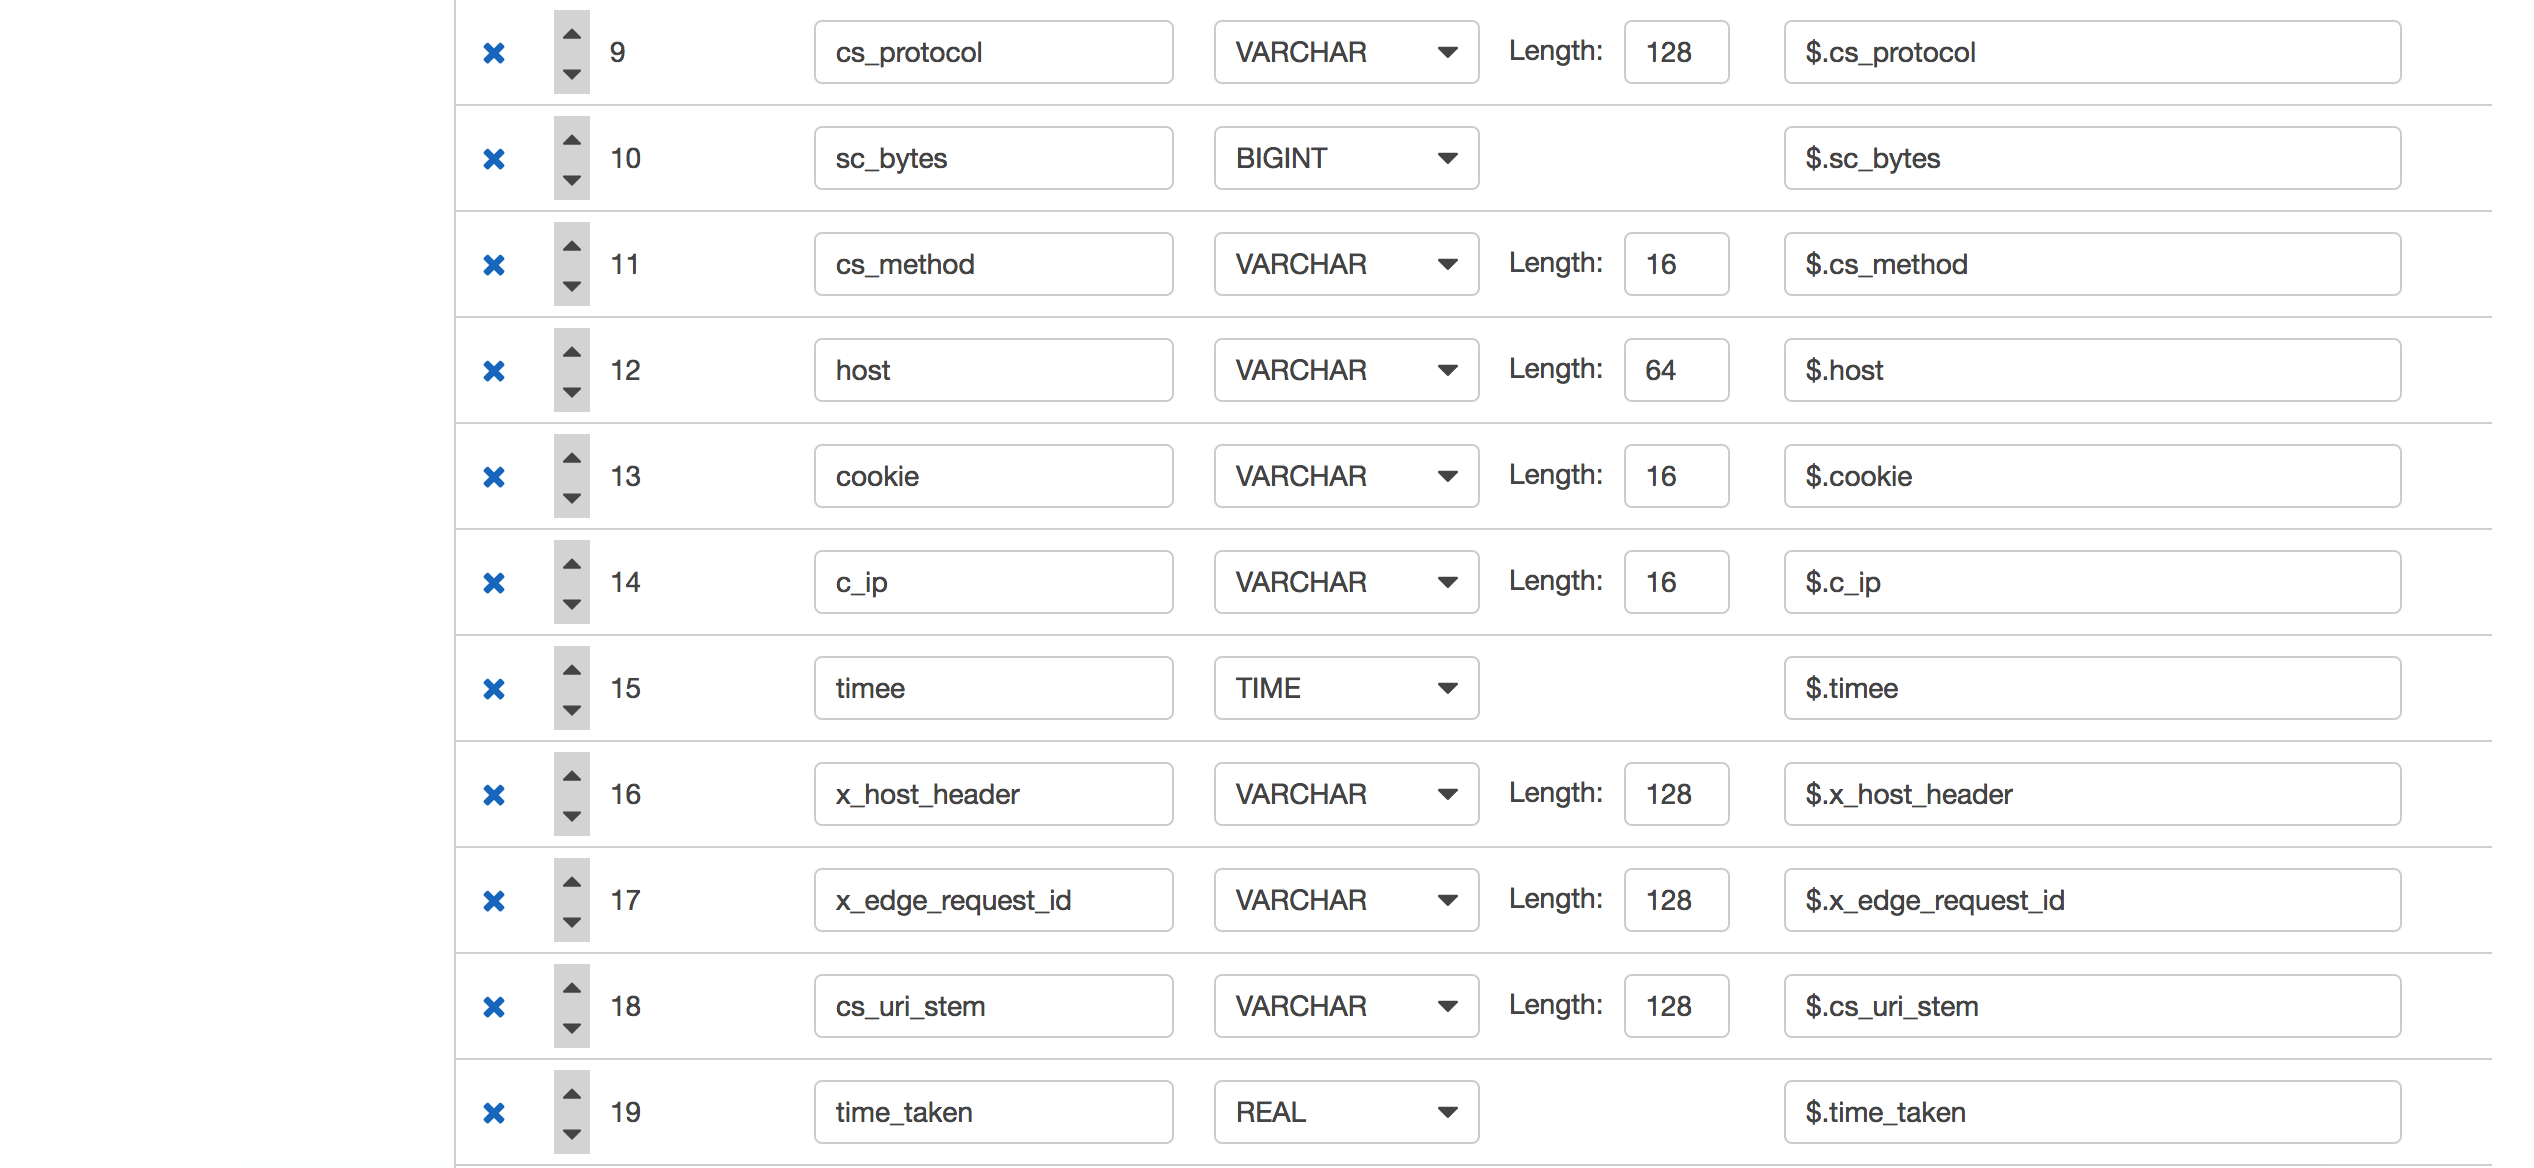
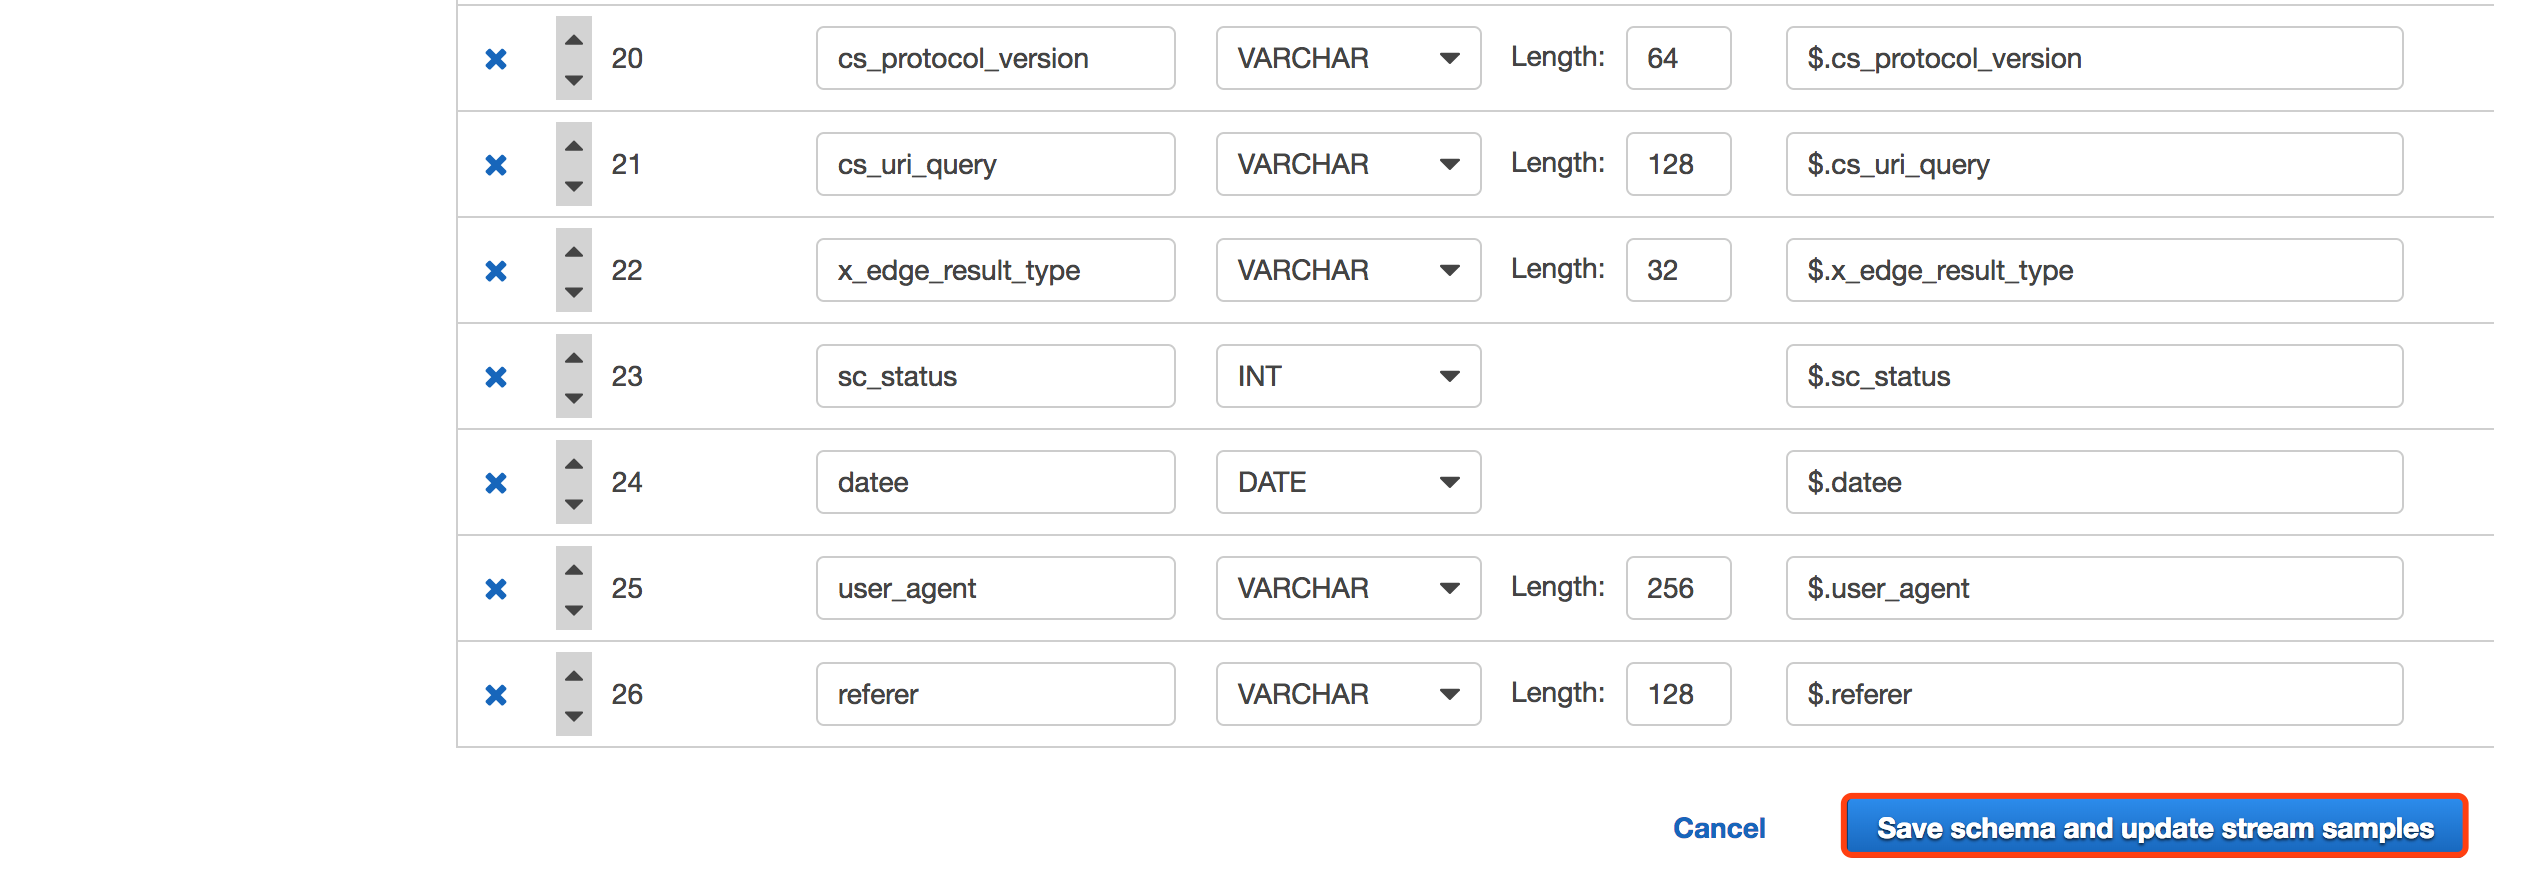 Click “Save Schema and Update Stream Samples” to verify that the field types and lengths have been modified successfully, then click “Exit” to return to the previous step.
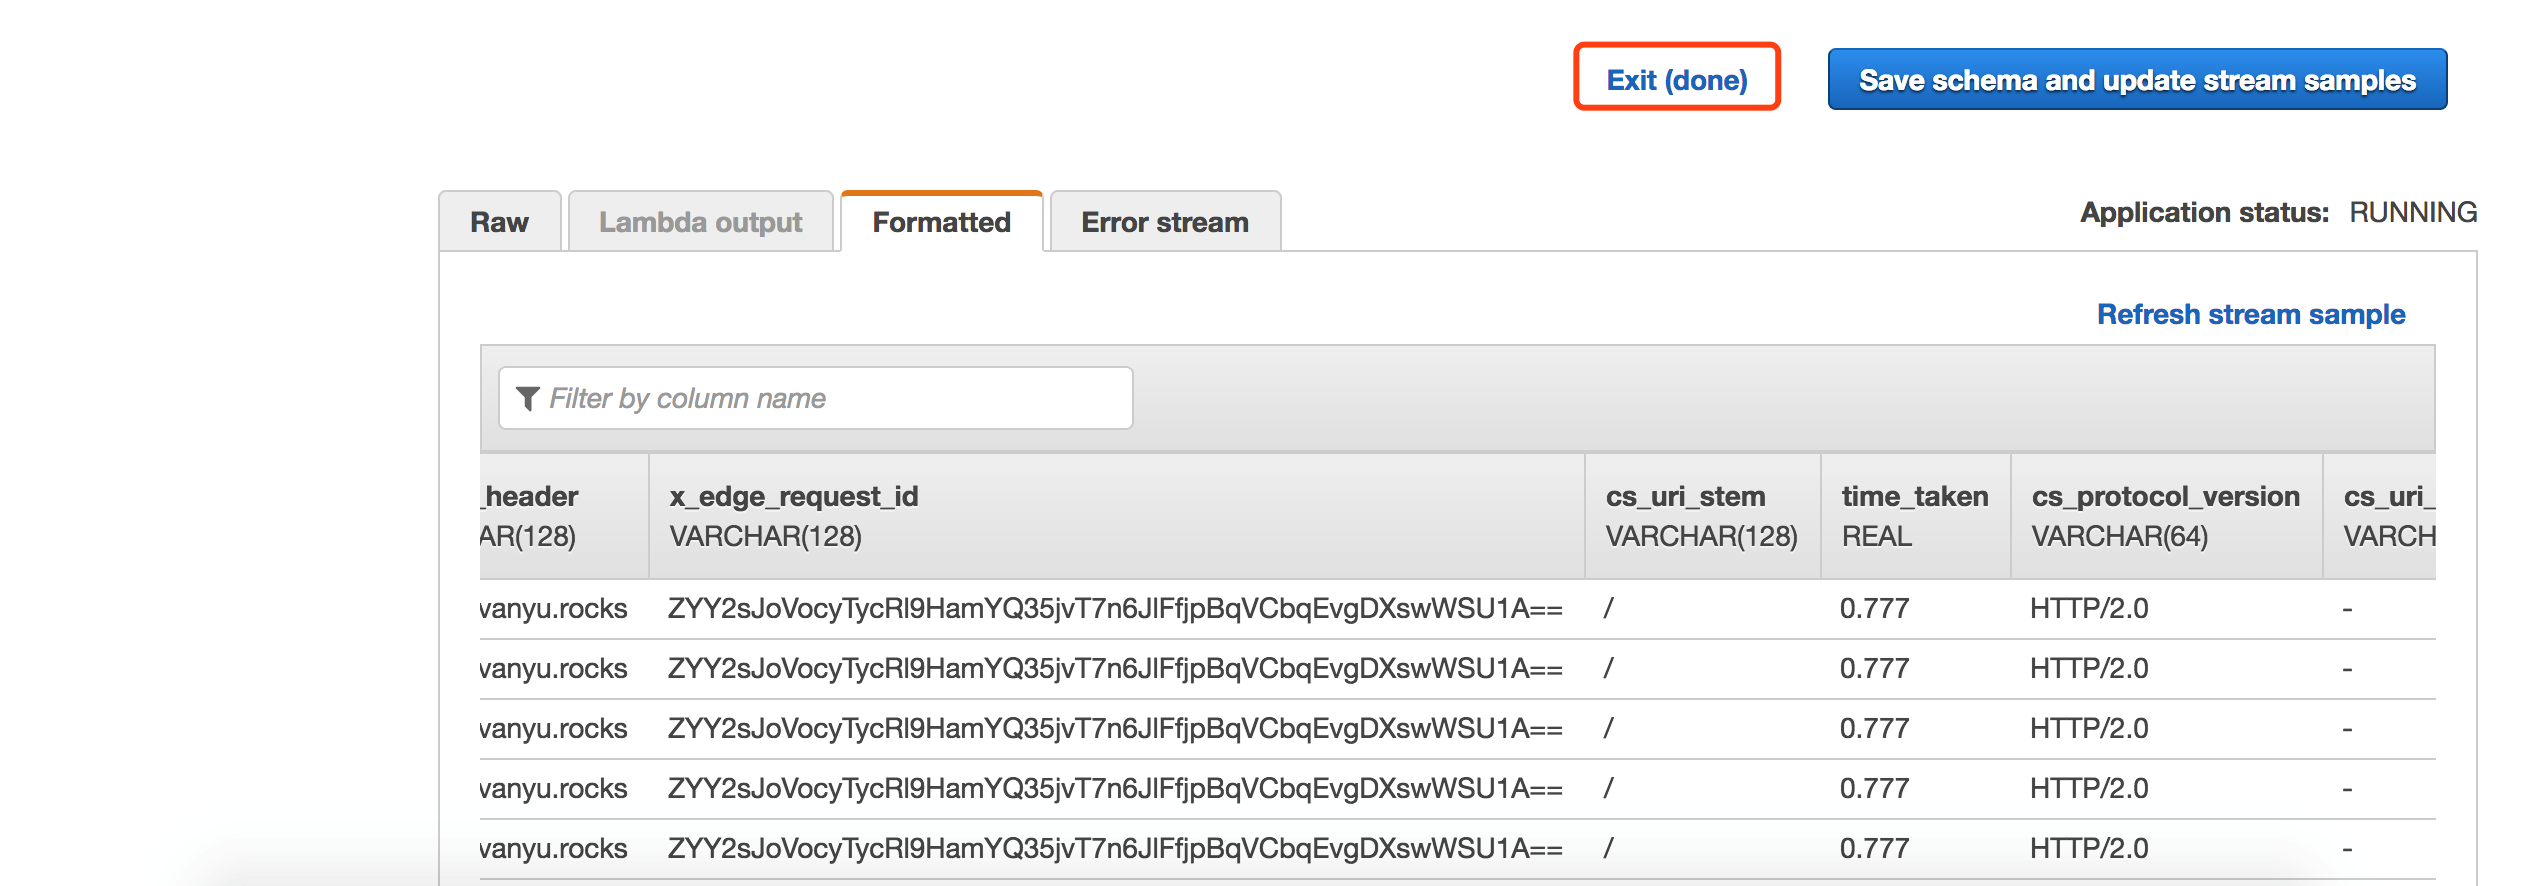
Click “Save and Continue” to proceed.
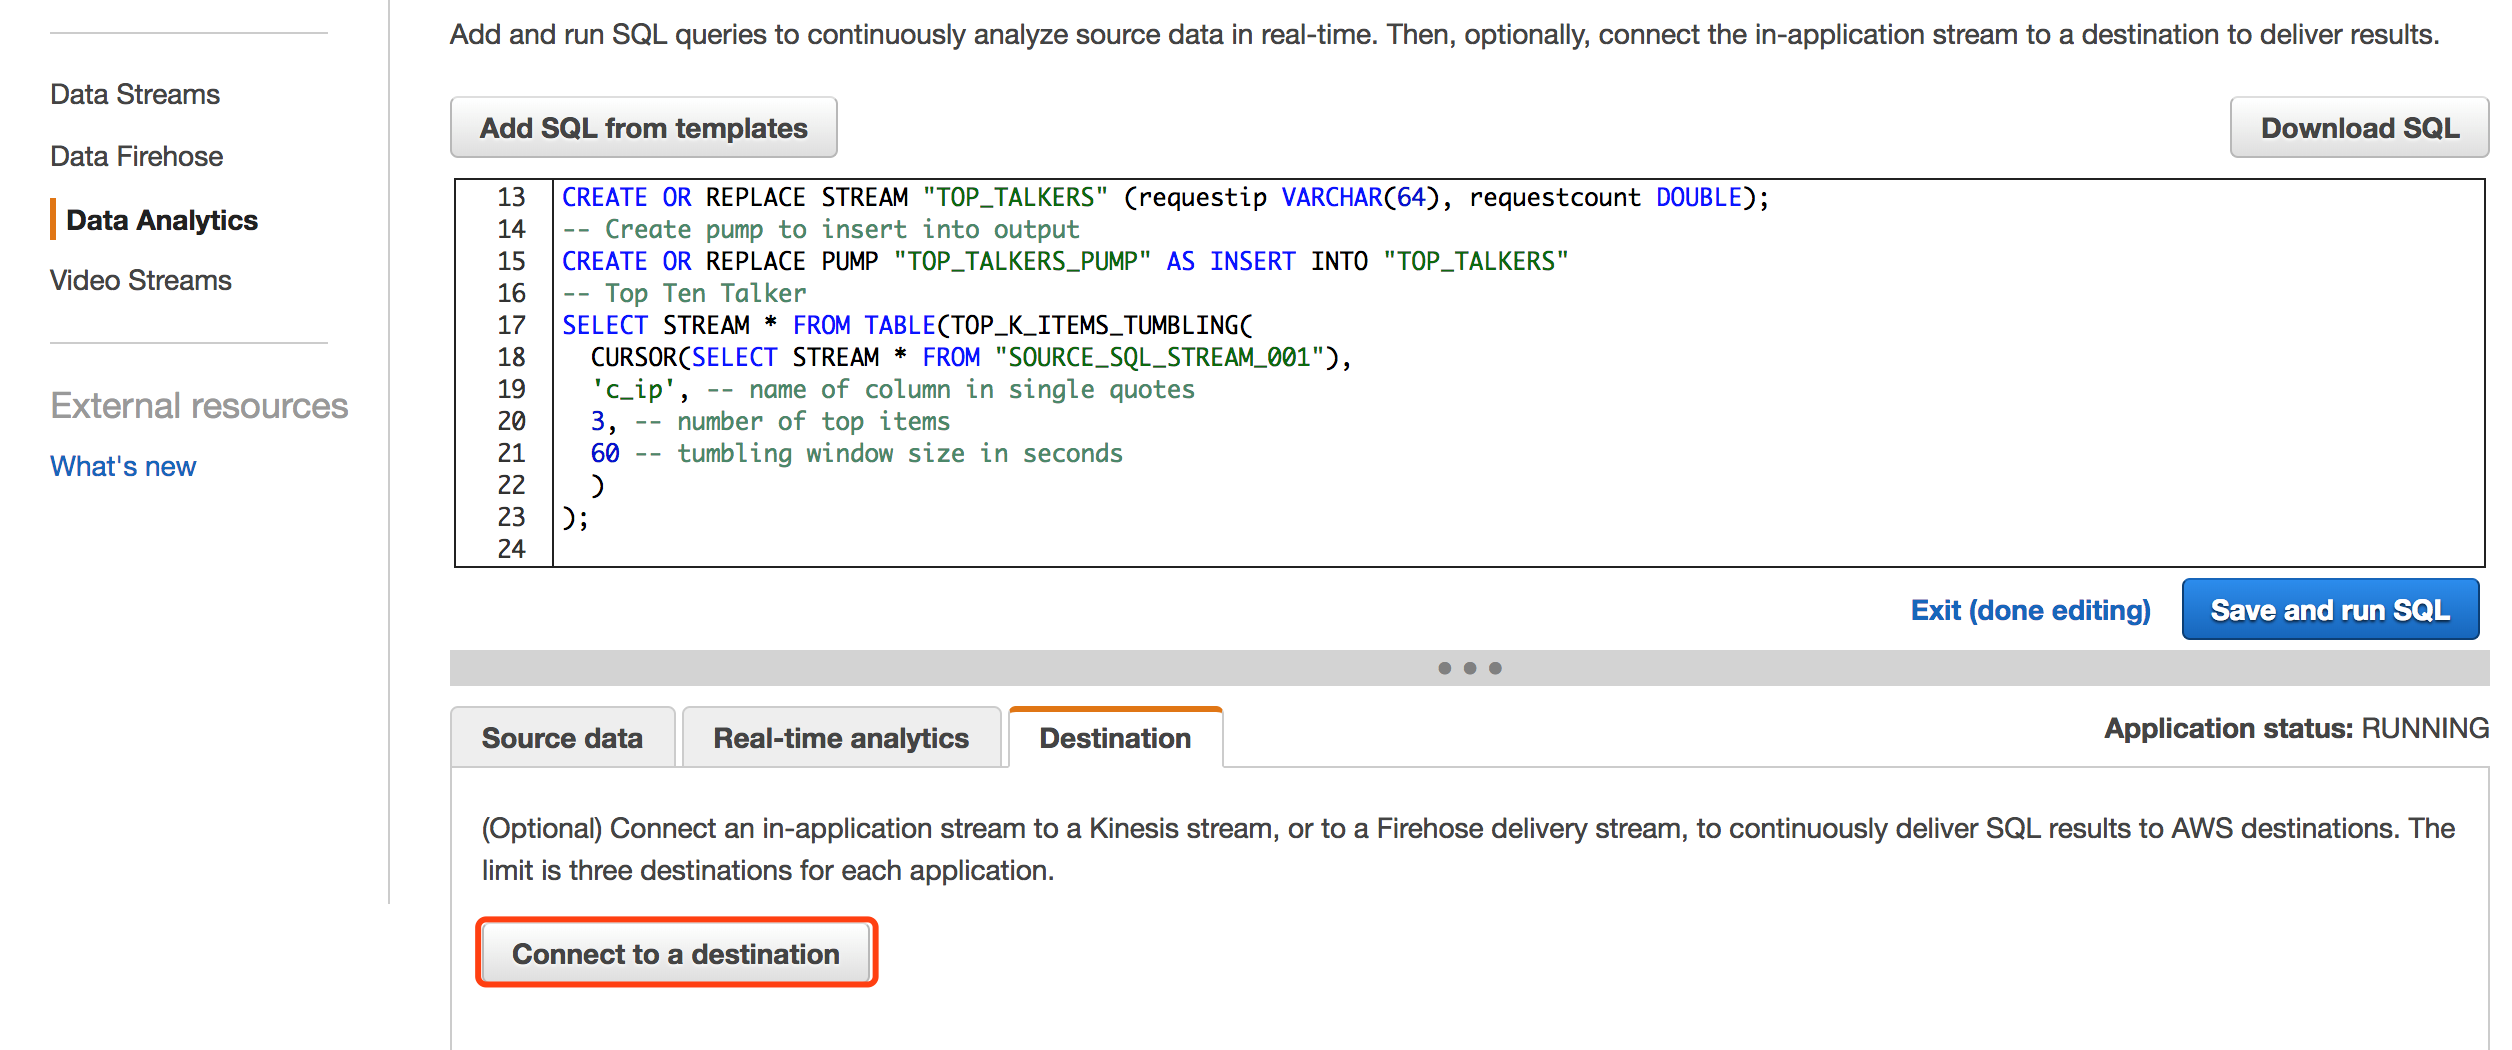
Next, we start using SQL statements to analyze and aggregate streaming data with schemas.
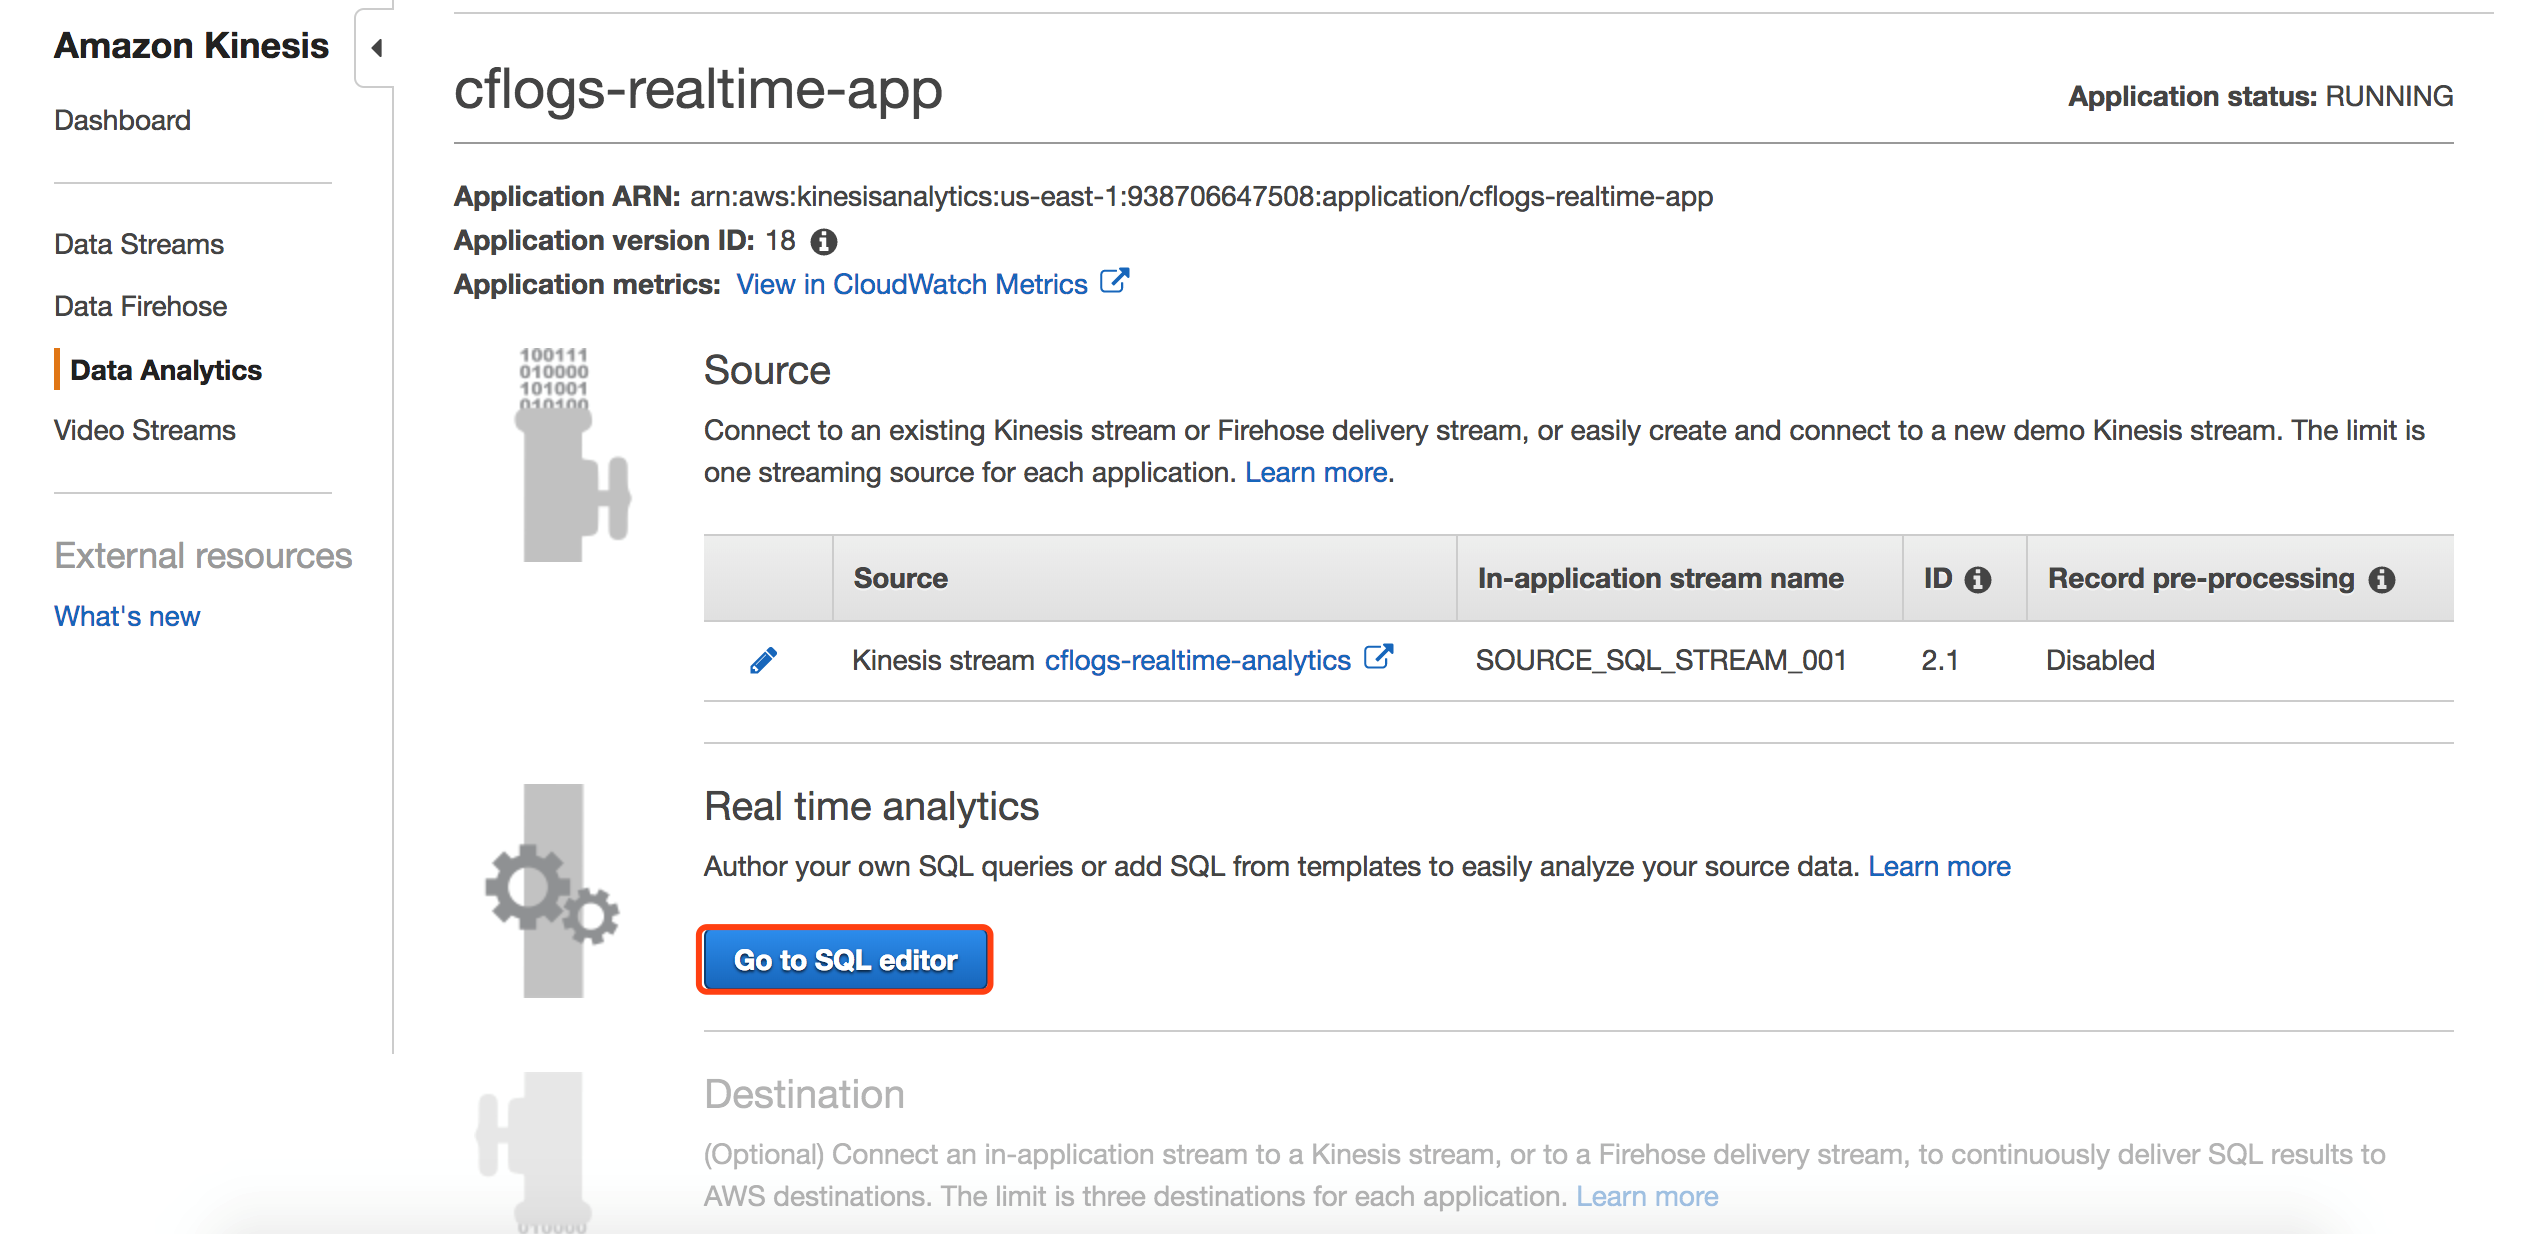
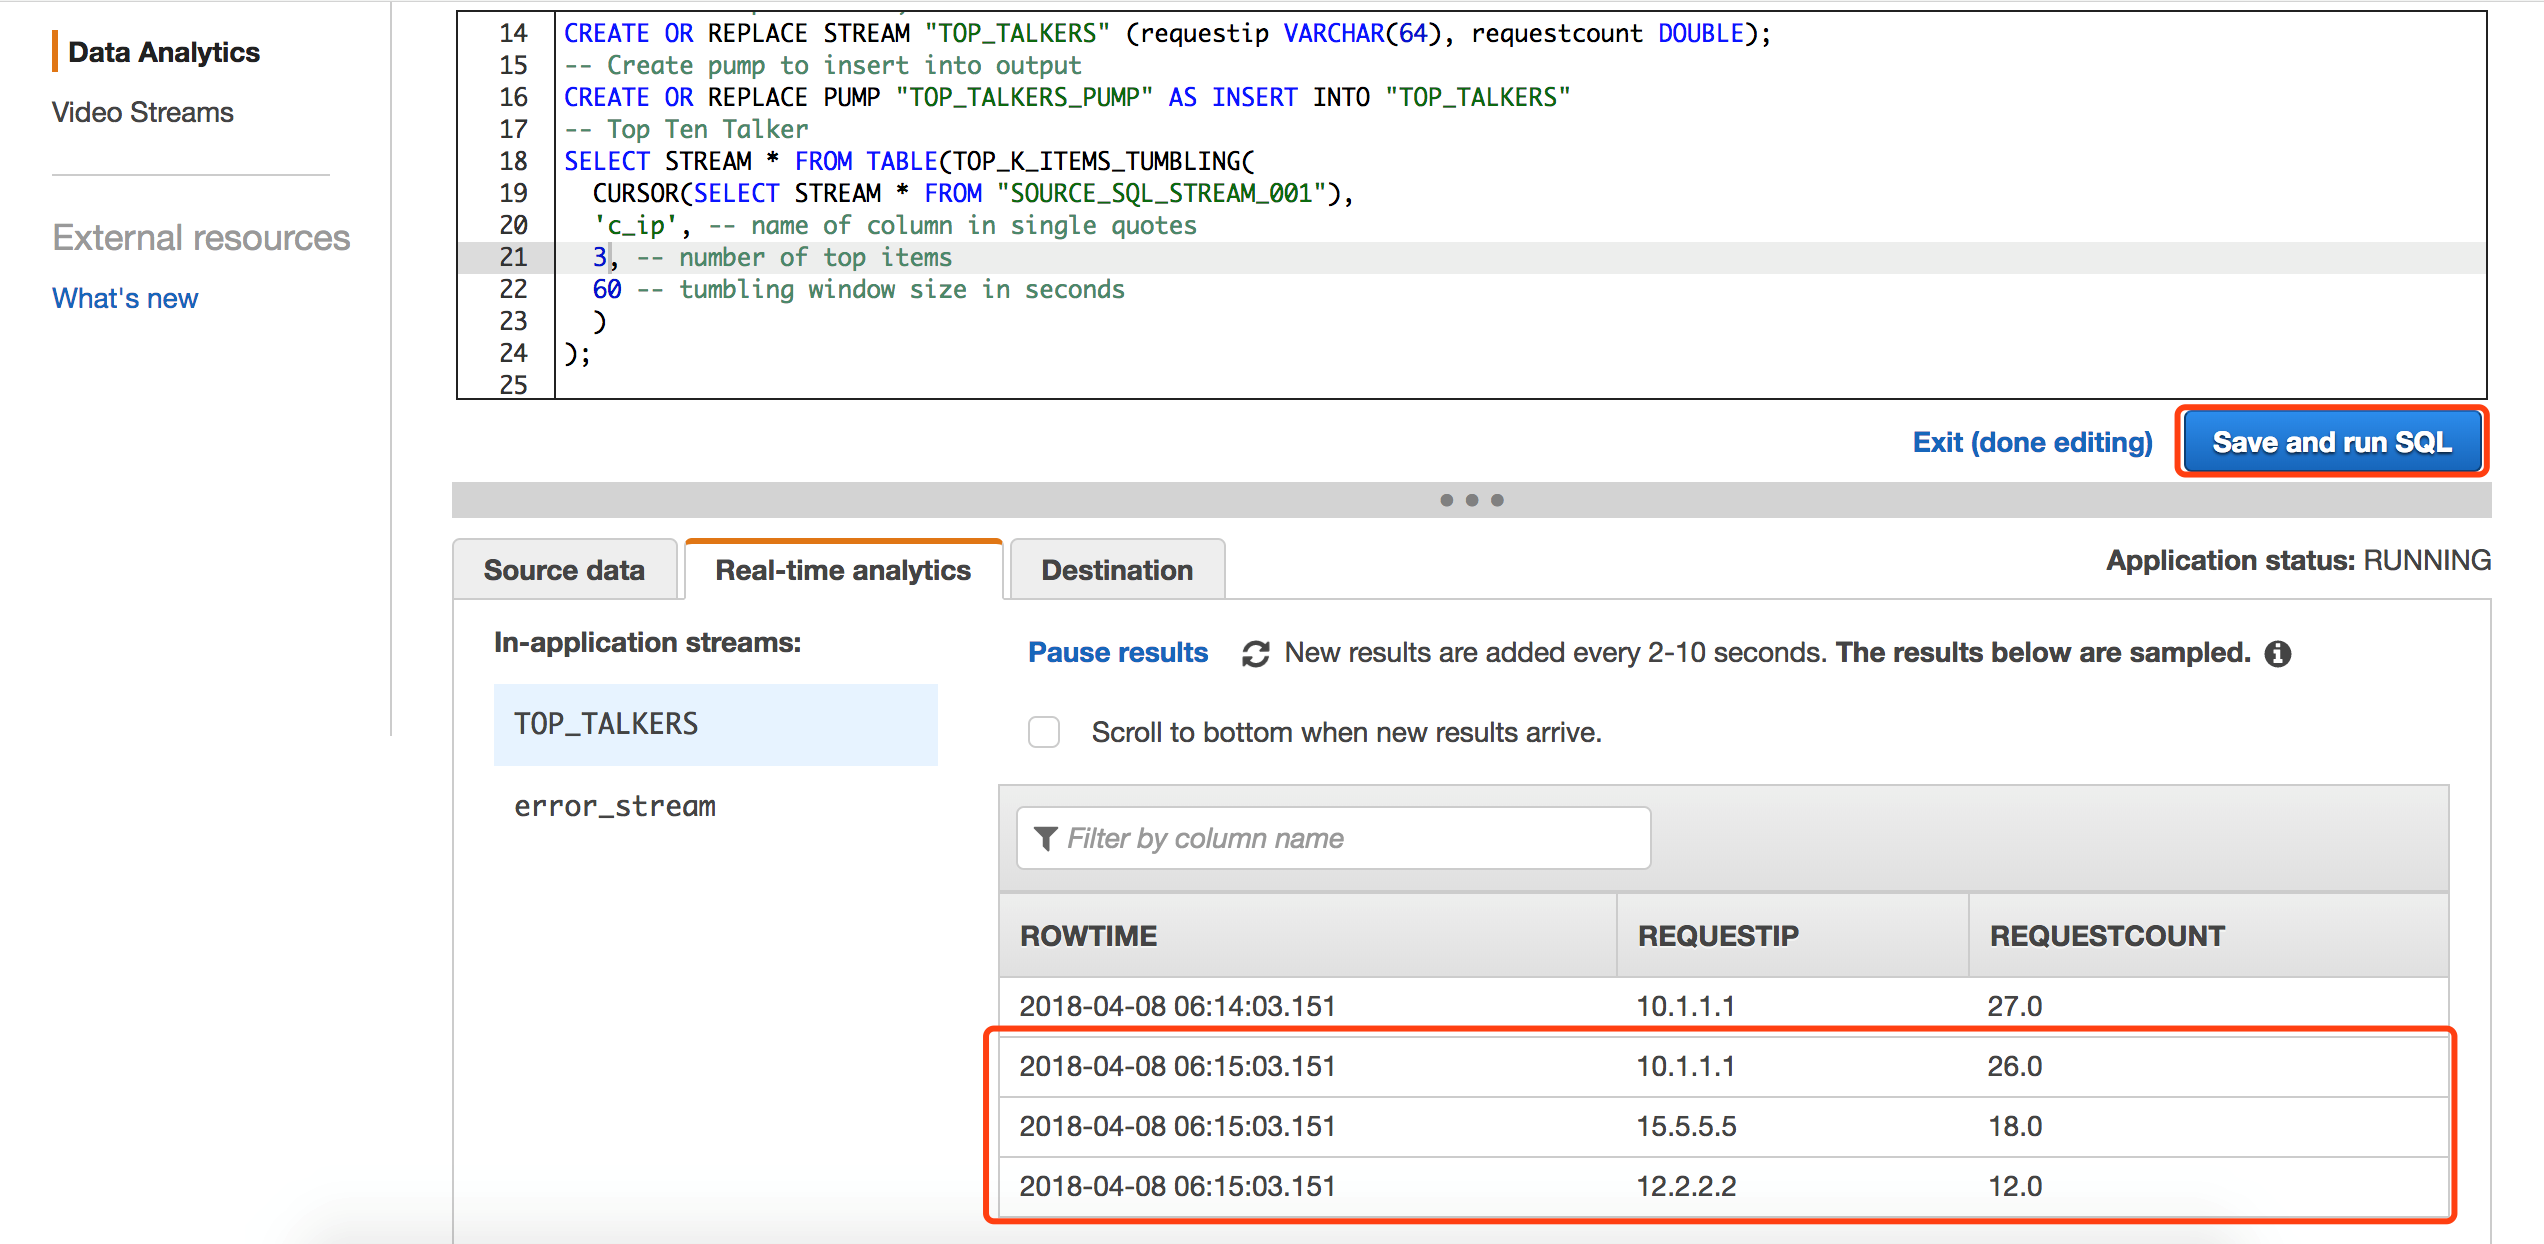
The SQL statement below analyzes the top 3 user IP addresses accessing CloudFront within a 1-minute time window. Kinesis Analytics windows allow you to observe the analysis results per minute in real-time, which is very convenient for debugging.
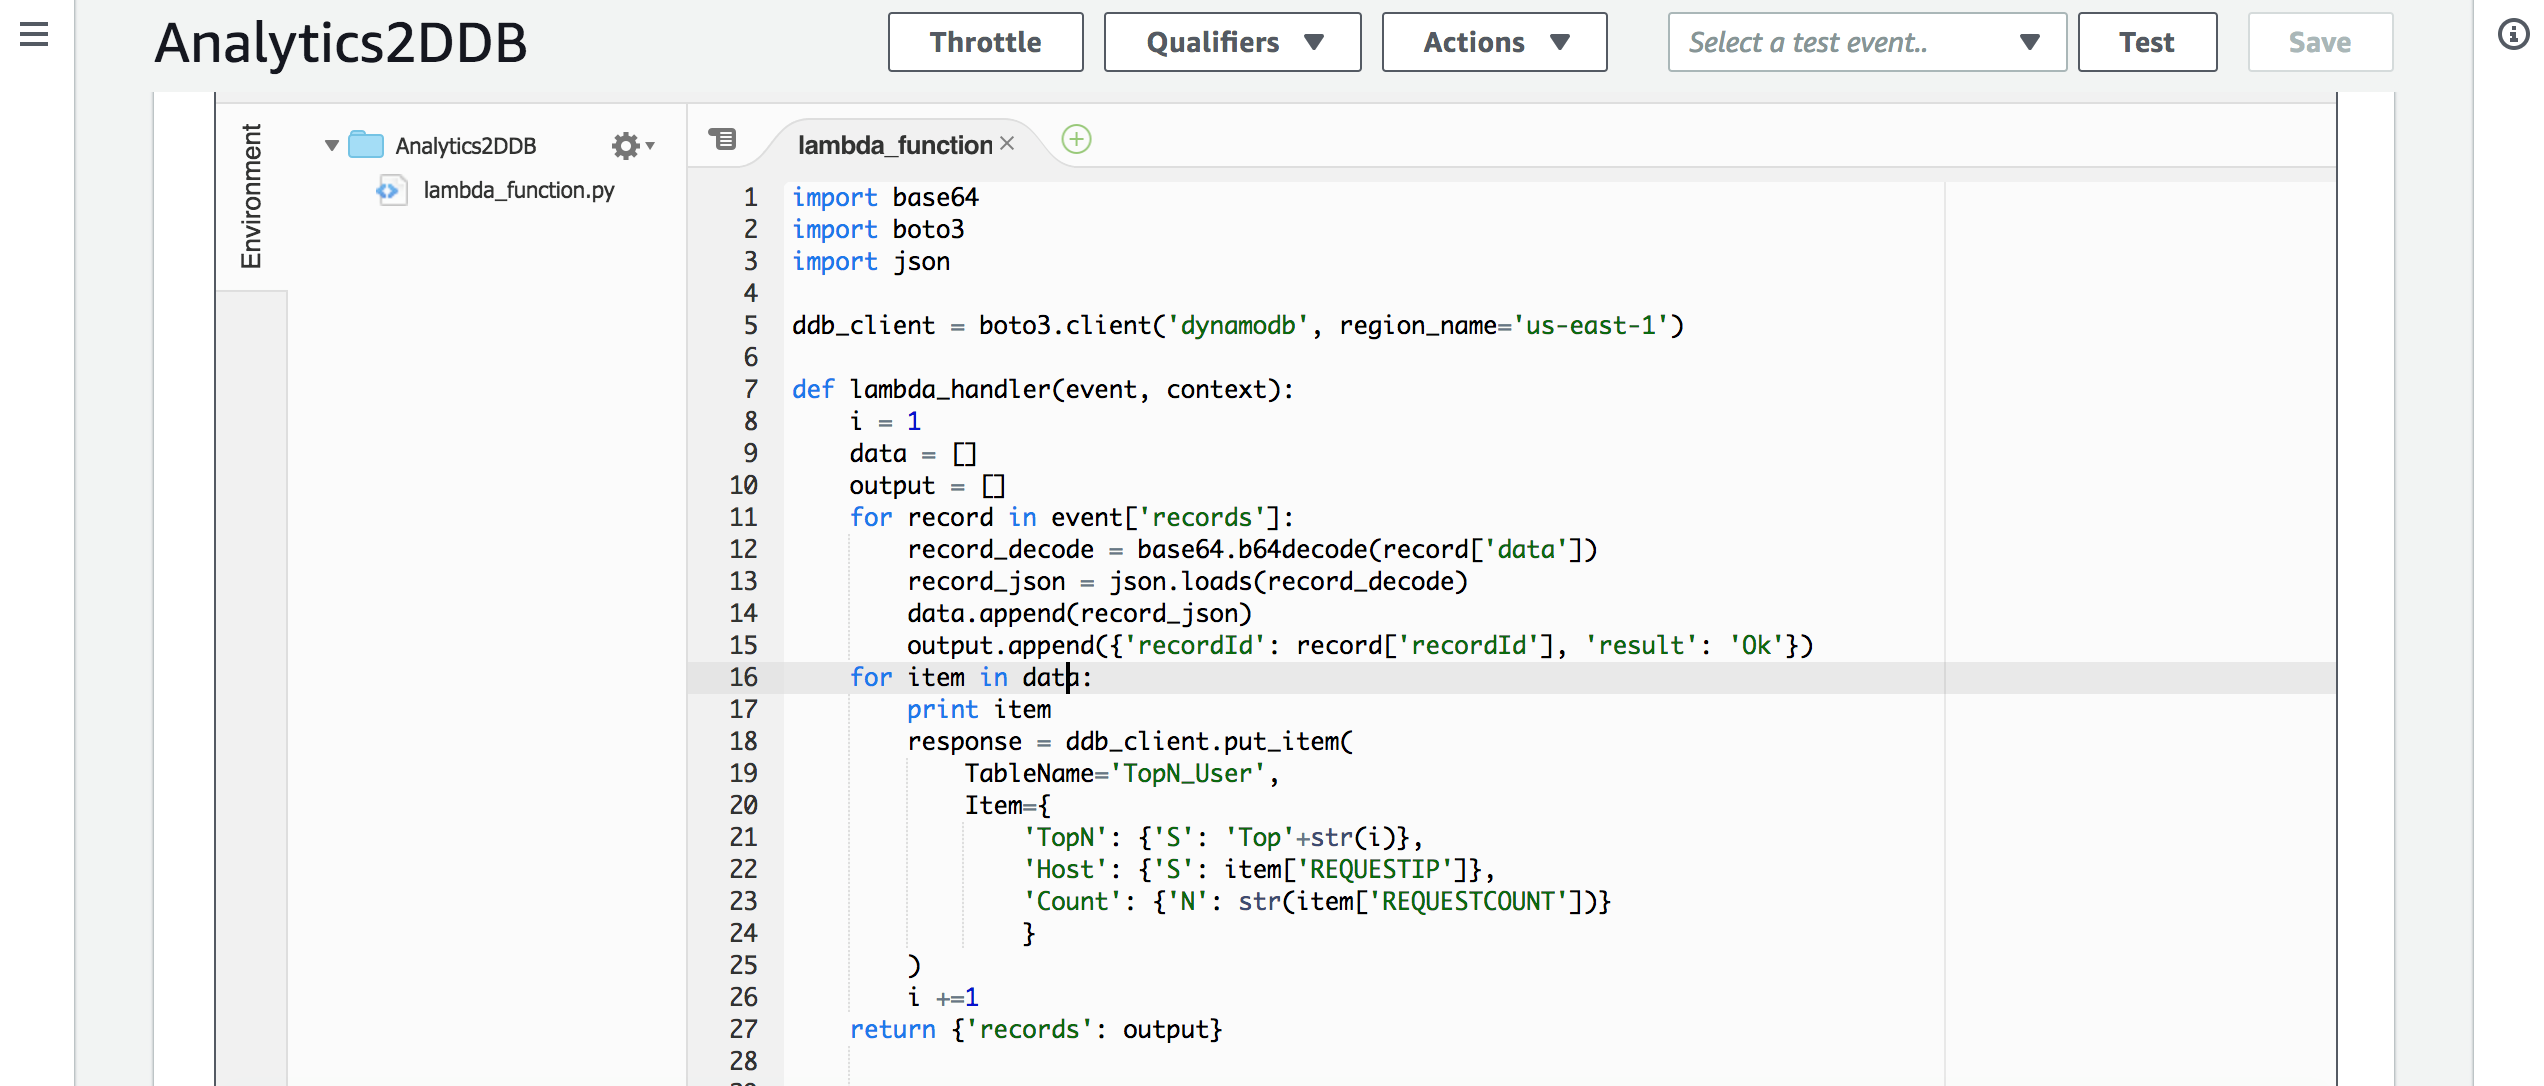
Before configuring Kinesis Analytics to output the analysis results, let’s first configure the Lambda function to receive the output results and save them to DynamoDB. The Lambda code can be obtained from the following link:
https://github.com/iwasnobody/cflogs2analytics2ddb/blob/master/Analytics2DDB.py
Note: Depending on the size of the output results, you need to adjust the timeout duration of the Lambda function.
Then, we return to the Kinesis Analytics interface to configure the application’s output destination.
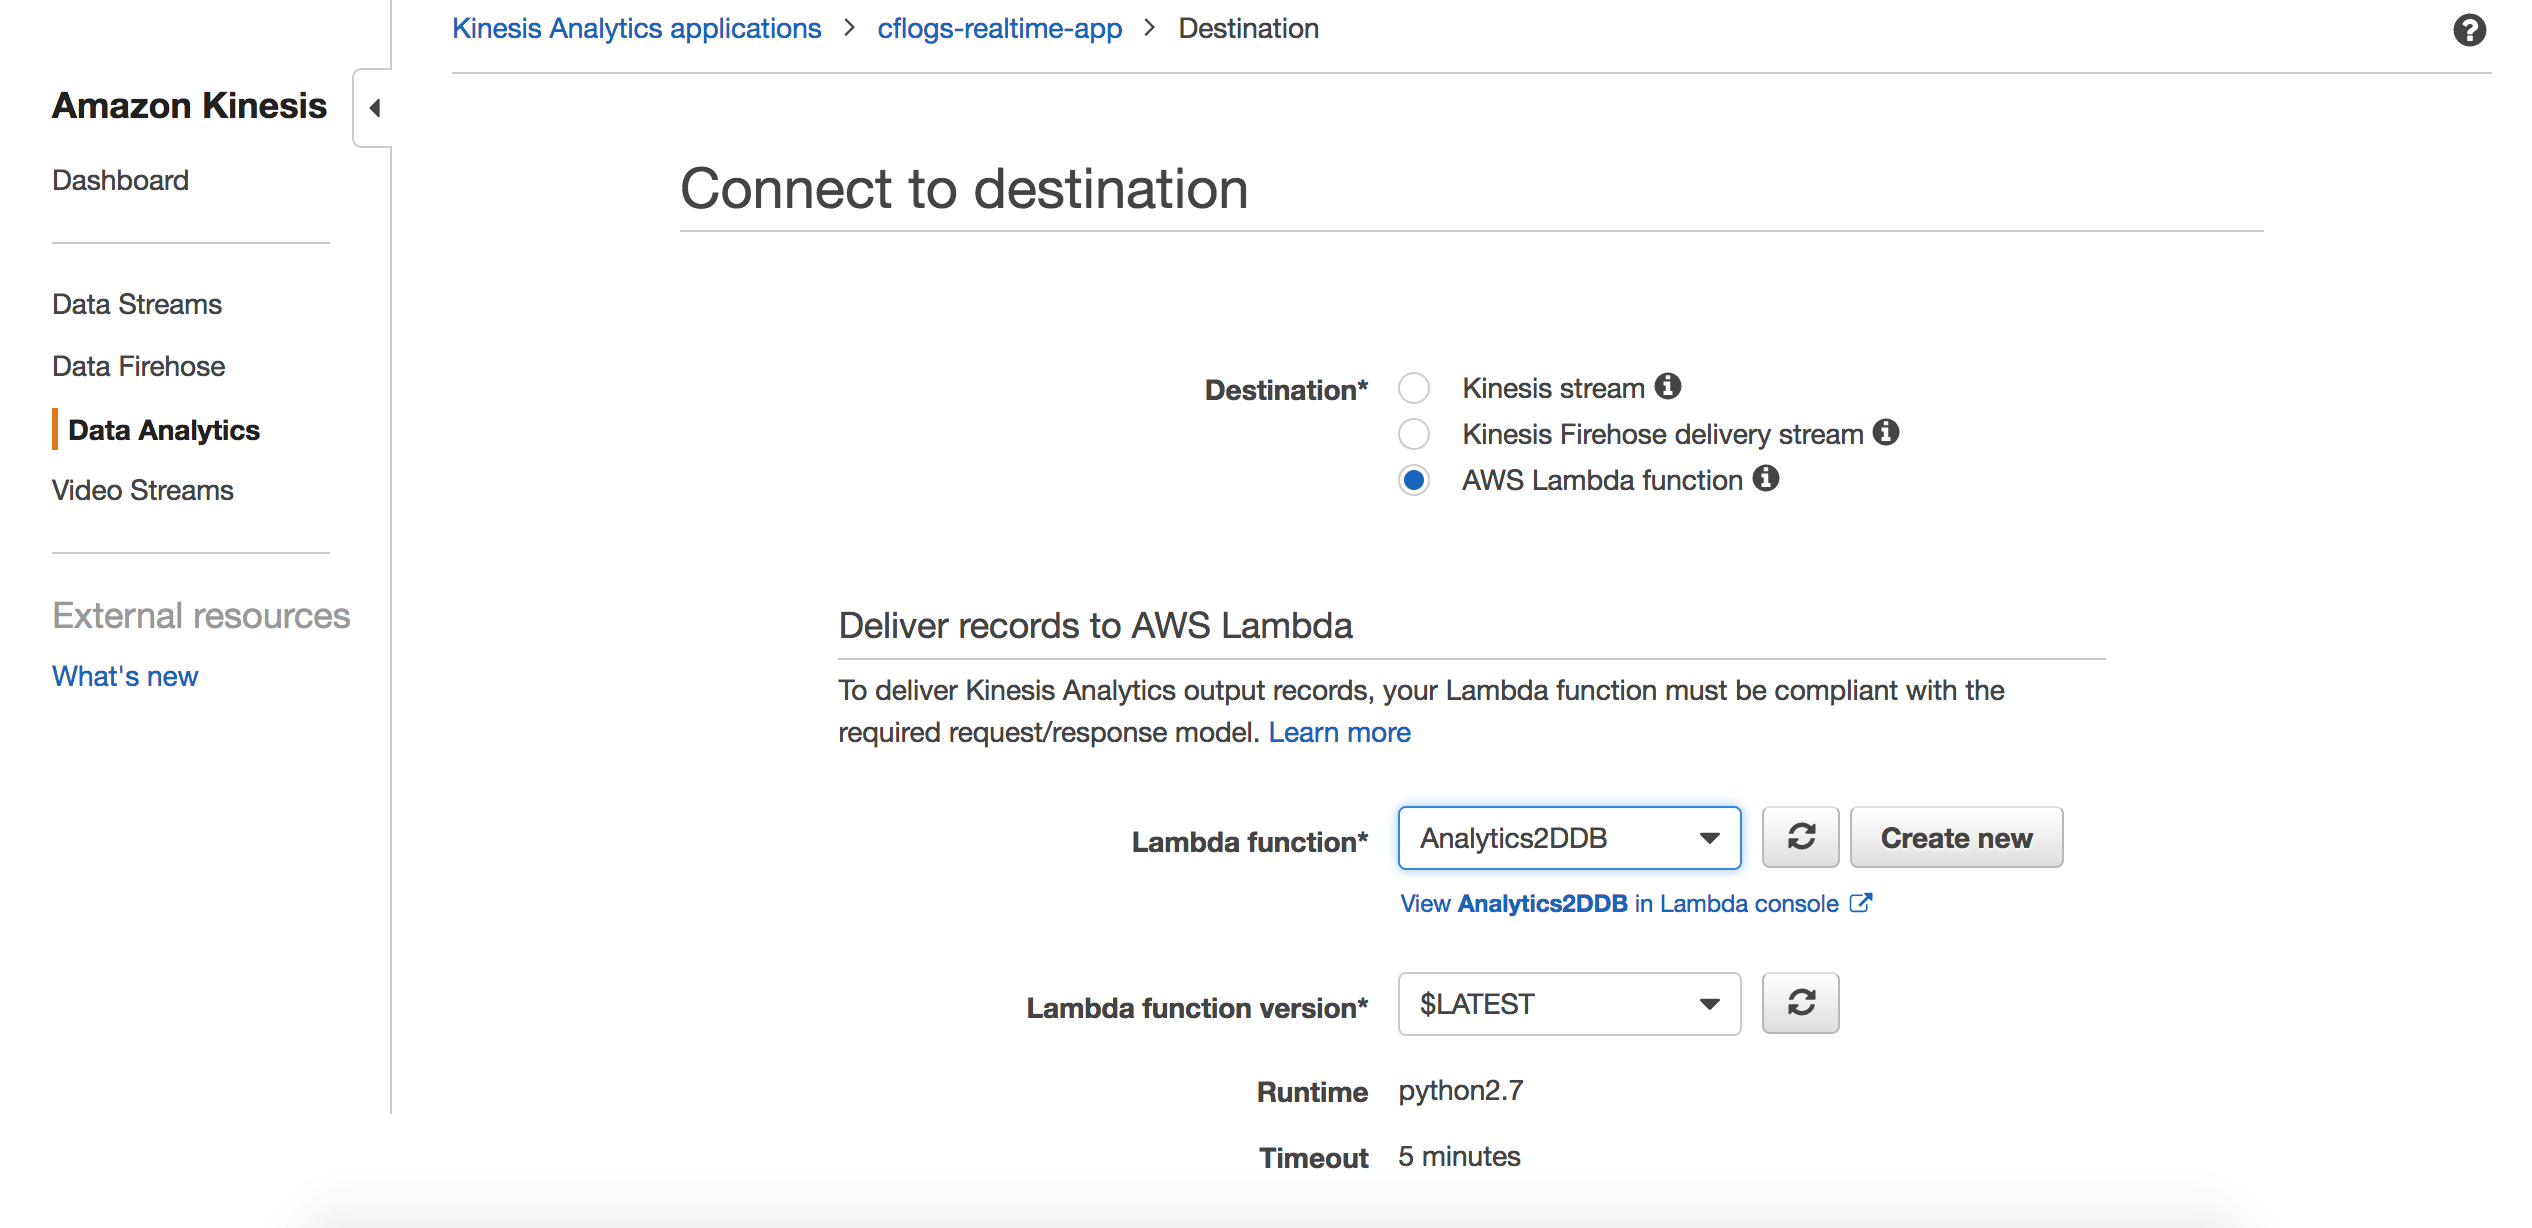
Set the Lambda function created earlier to receive the output results.
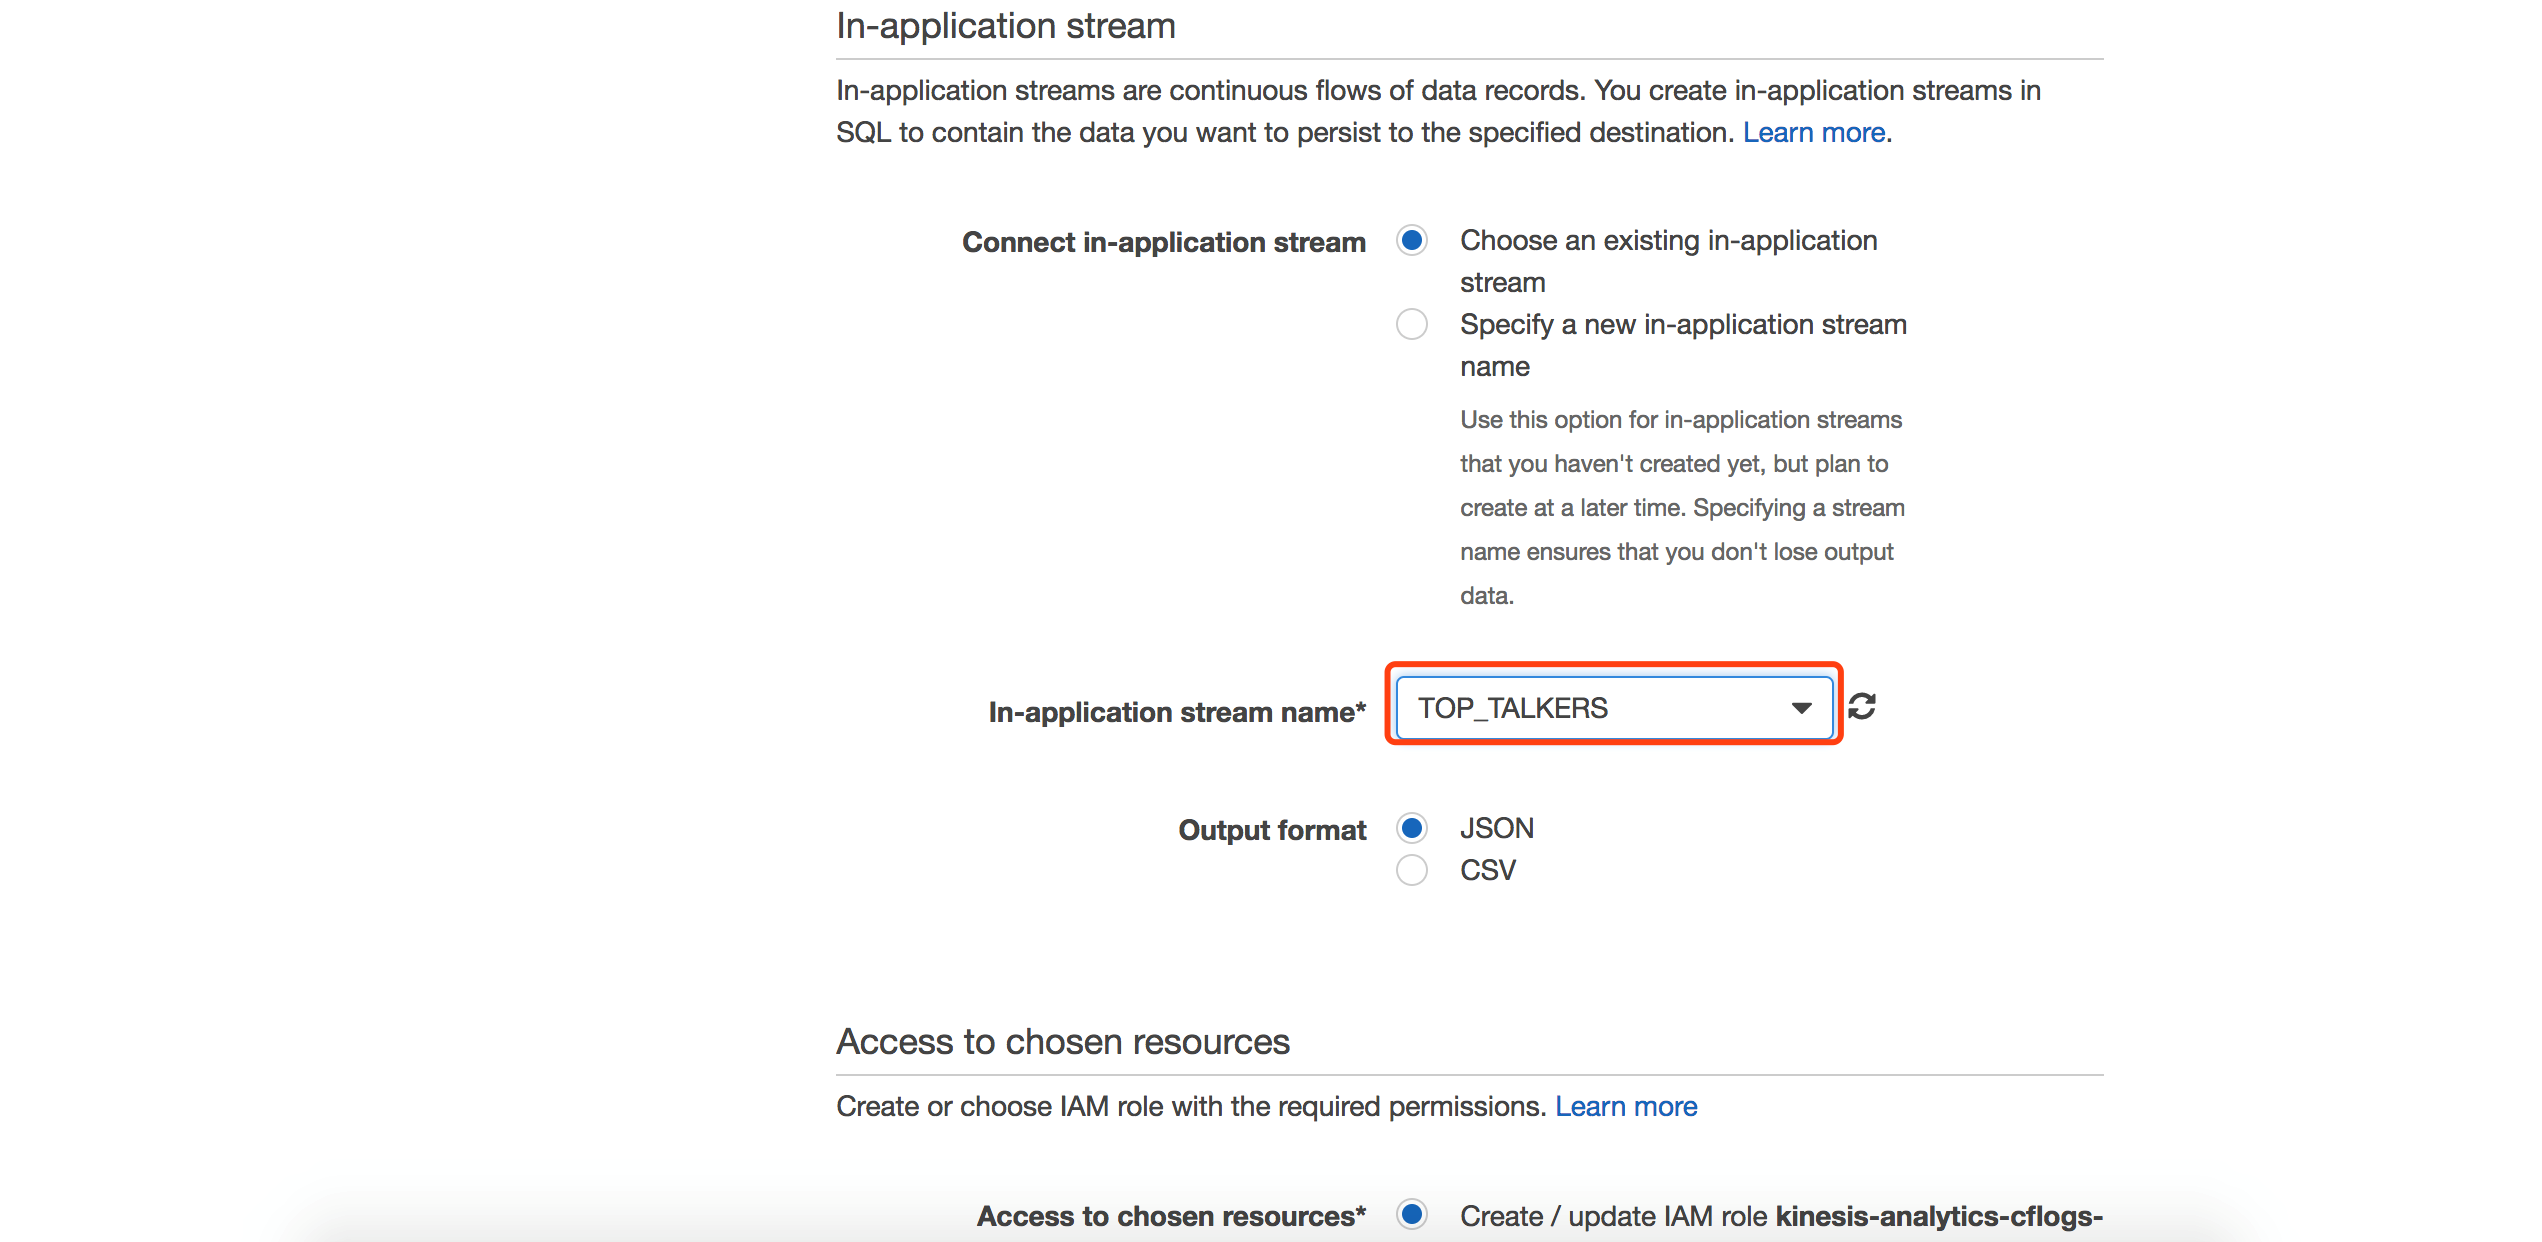
Step 4: View Analysis Results
We can go into DynamoDB to view the previously created table and continuously refresh to observe changes in the table data.
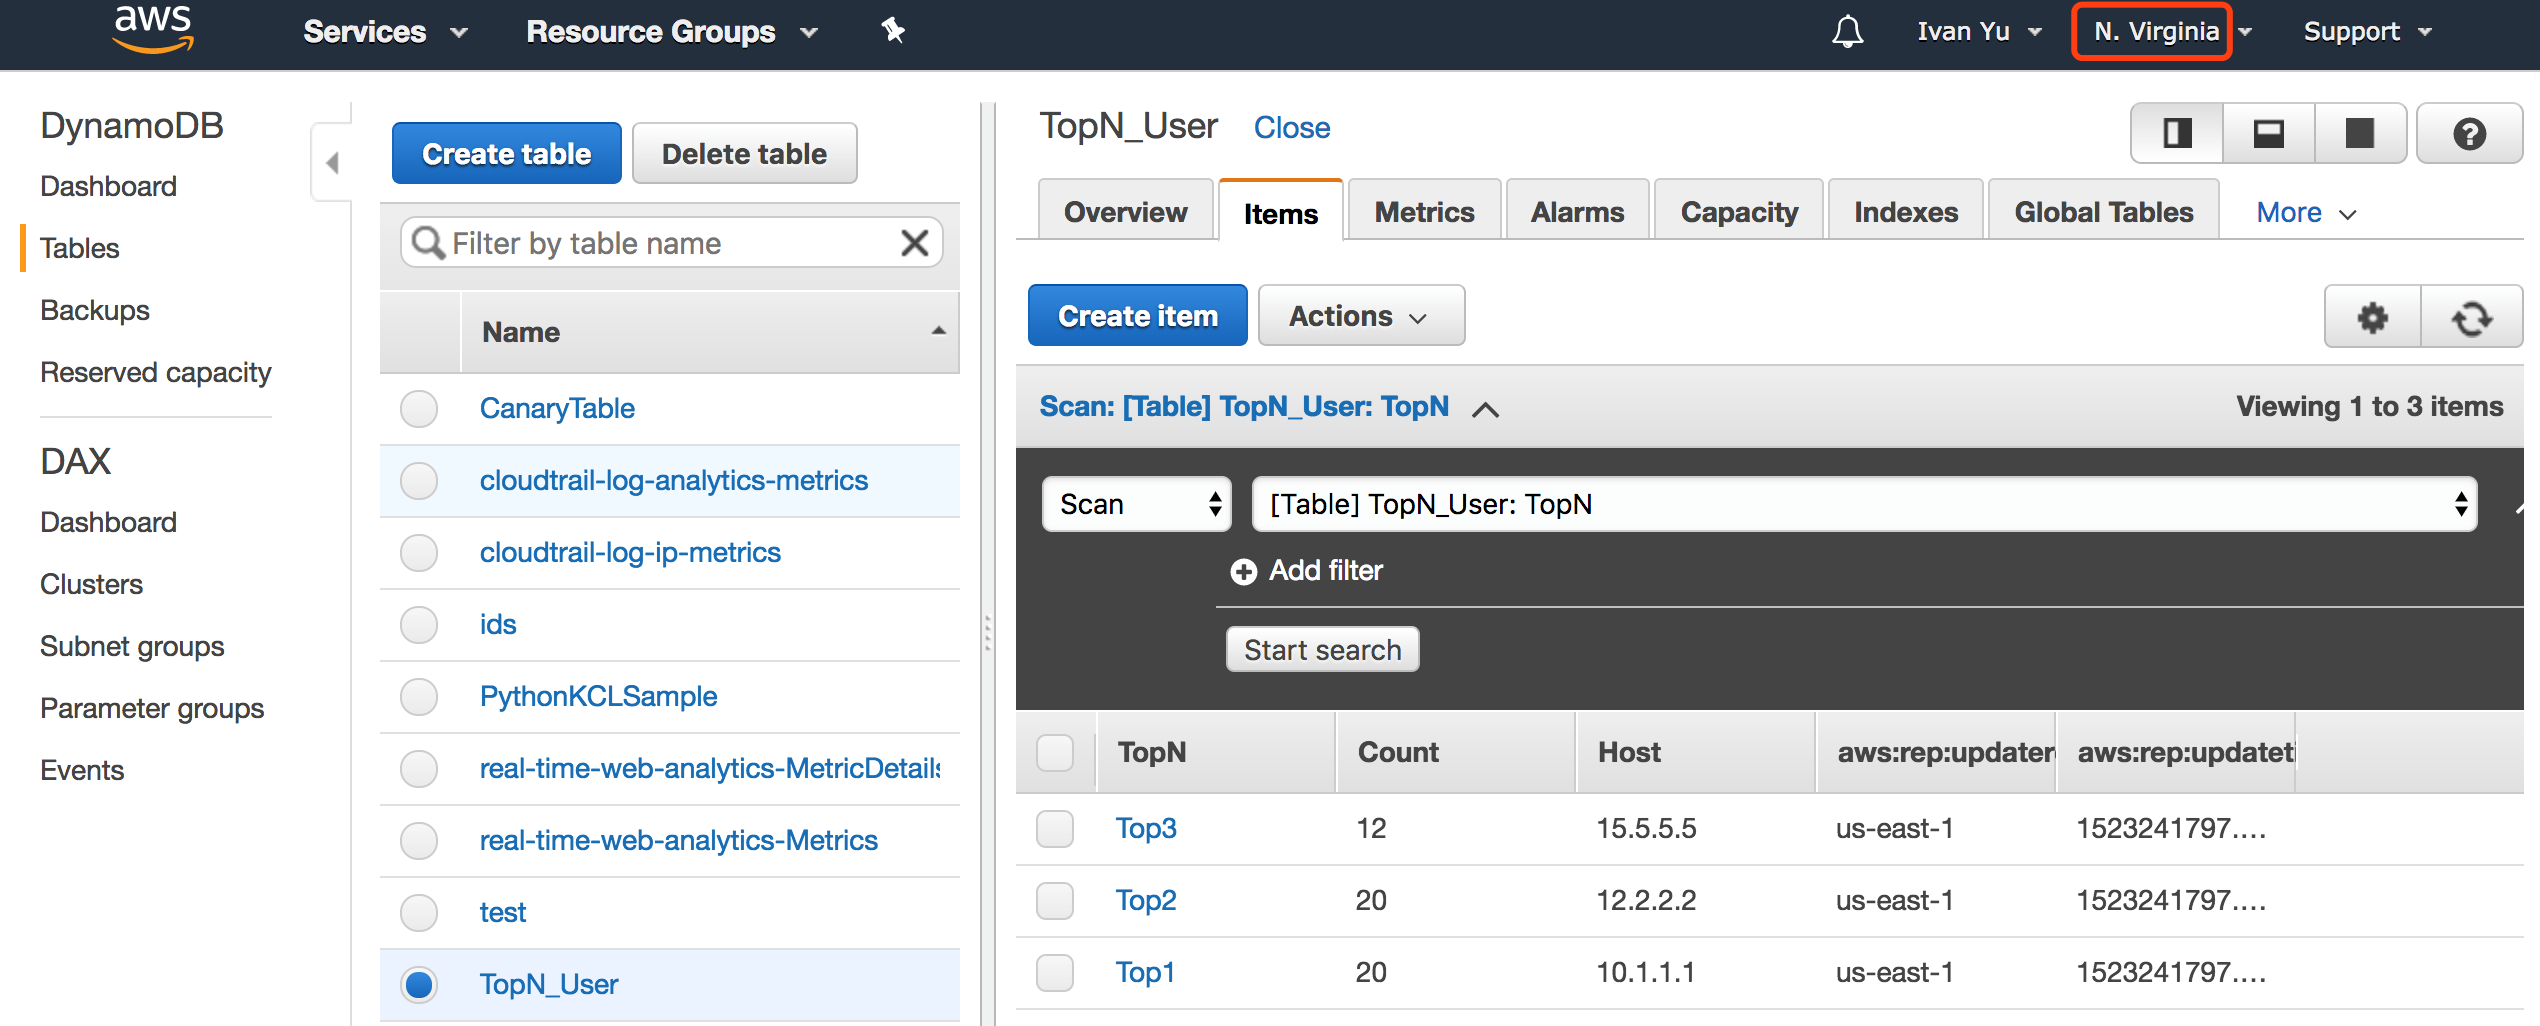
At the same time, navigate to the Ohio region to verify that the data has been synchronized.