Resource and Application Service Layer Monitoring
Amazon CloudWatch monitoring and alerting platforms help customers uniformly manage and operate AWS cloud and on-premises resources, services, and business systems. By using Amazon CloudWatch, you can collect and track metrics, collect and monitor log files, and set up alerts. You can gain comprehensive insights into resource utilization, application performance, and health status through Amazon CloudWatch. Using these analytics results, you can respond in time to ensure smooth application operation.
Basic Concepts of Amazon CloudWatch
Please refer to the AWS Official Documentation to understand the core concepts and terminology of Amazon CloudWatch, such as metrics, namespaces, dimensions, timestamps, units, statistics, periods, aggregation, alarms, etc.
Monitoring and Alerting Platform Architecture Based on CloudWatch
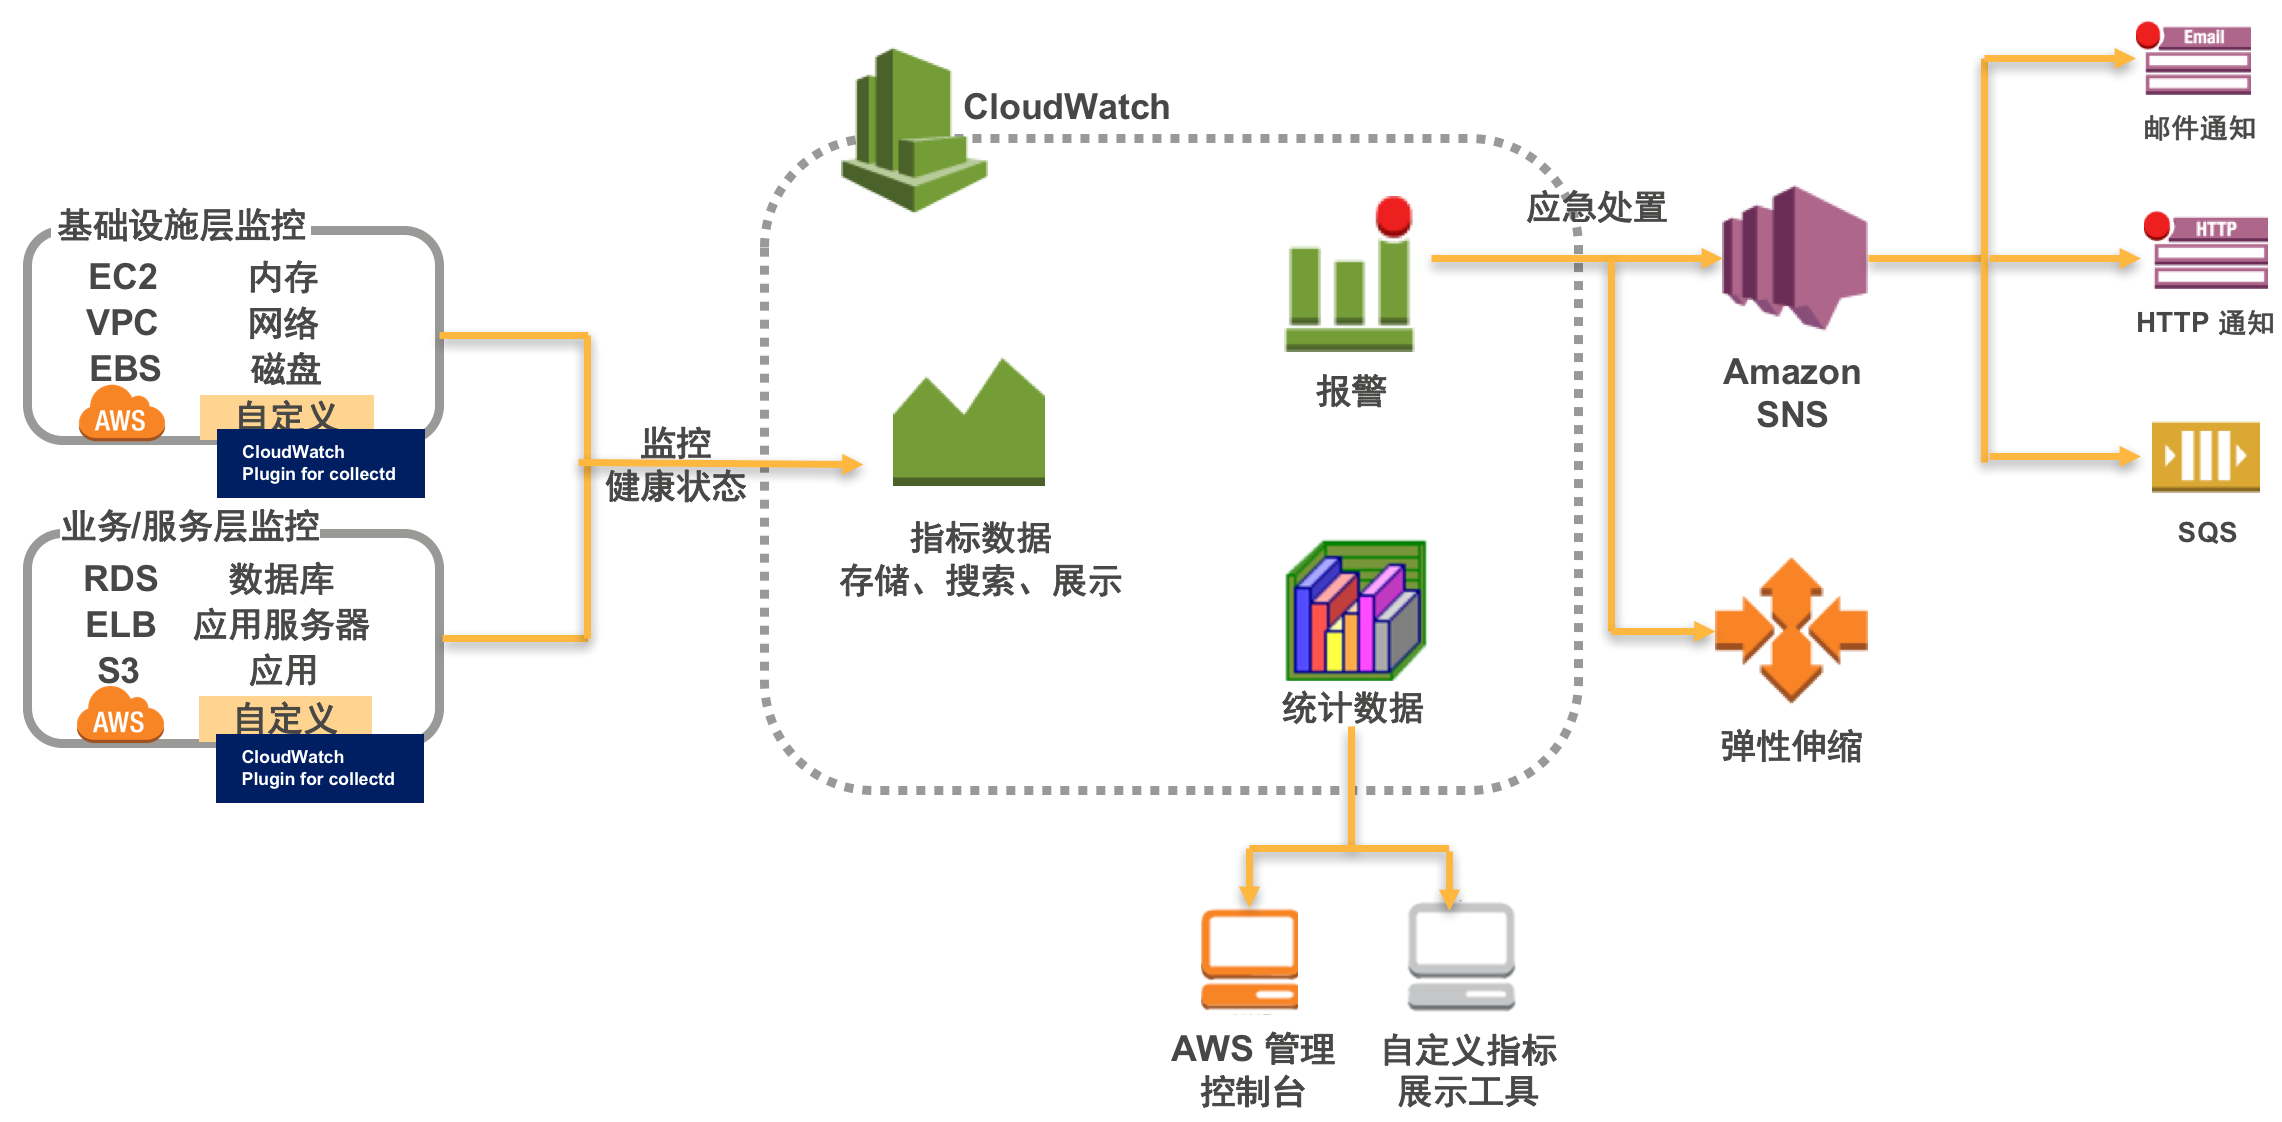
CloudWatch provides a standard set of API interfaces, allowing users to publish custom application, business, or more detailed system metrics via this platform. Metrics published to Amazon CloudWatch are sets of data points sorted by time; these data points can originate from any application or business activity. Metrics are uniquely defined by name, namespace, and dimension. Dimensions help you design grouping features or categories for data points. When publishing metric data points, you must specify dimensions. For example, regarding virtual machine CPU usage, users can view monitoring metrics for a single VM or view them grouped by an Auto Scaling group. Here, the individual VM or Auto Scaling group represents different dimensions for the same data point. Users can publish custom metrics at second-level or even millisecond-level frequencies, but Amazon CloudWatch will still aggregate the data to a minimum granularity of 1 minute.
Based on metric data, users can translate business fluctuations and anomalies into corresponding metrics, thereby creating alarms to automate responses to various abnormal situations. Actions include elastic scaling (Auto Scaling) mechanisms to handle traffic changes, email notifications bound to Amazon SNS topic subscriptions, HTTP request calls, and asynchronous processing via message queues.
Metric data can be directly filtered, viewed, and shared graphically by time via the AWS console. Additionally, users can obtain metric data via API interfaces for third-party processing and display. CloudWatch retains metric data for two weeks by default (some overseas regions support free storage of statistical data for up to 15 months; see details in the AWS CloudWatch documentation).
In the architecture described in this article, custom metric collection does not require manual programming but utilizes the collectd daemon for monitoring and acquisition. Simultaneously, the CloudWatch Plugin for collectd directly publishes and stores custom metrics to CloudWatch. Users can then perform automated alarm processing based on these custom metrics to achieve a hands-free unified monitoring platform.
What is the CloudWatch Plugin for collectd?
CloudWatch has always supported users in publishing custom metrics to store, monitor, and assess the health of their business, applications, and systems. AWS recently released the open-source project “CloudWatch Plugin for collectd.” This plugin integrates collectd’s powerful ability to collect various types of statistical data, helping customers simplify the development work related to collecting custom metrics. It supports out-of-the-box publishing of monitoring data such as Apache and Nginx Web server application metrics and memory monitoring metrics to CloudWatch for unified storage, display, and alerting.
What is collectd?
collectd is a C-based daemon primarily used to collect statistical information. It provides various storage mechanisms to store different values. It supports over 100 types of plugins. Below is a list of some common plugin types; for specifics, please refer to the official collectd website.
- Web Applications: Apache, nginx
- Databases: MySQL, Oracle, PostgreSQL, memcached
- Network: OpenVPN, Ping, TCPConns,
- System: Memory, Disk, FileCount, vmem, uptime, df
Installing and Configuring the CloudWatch Plugin for collectd
The following steps use an EC2 instance in the Beijing (BJS) region as an example to illustrate how to install, configure, and use the CloudWatch Plugin for collectd:
User Authorization
This plugin supports authorization via IAM Role or IAM User. Following AWS best practices, we recommend using IAM Role for authorization. Therefore, before starting, let’s create an IAM Role and assign the corresponding permissions.
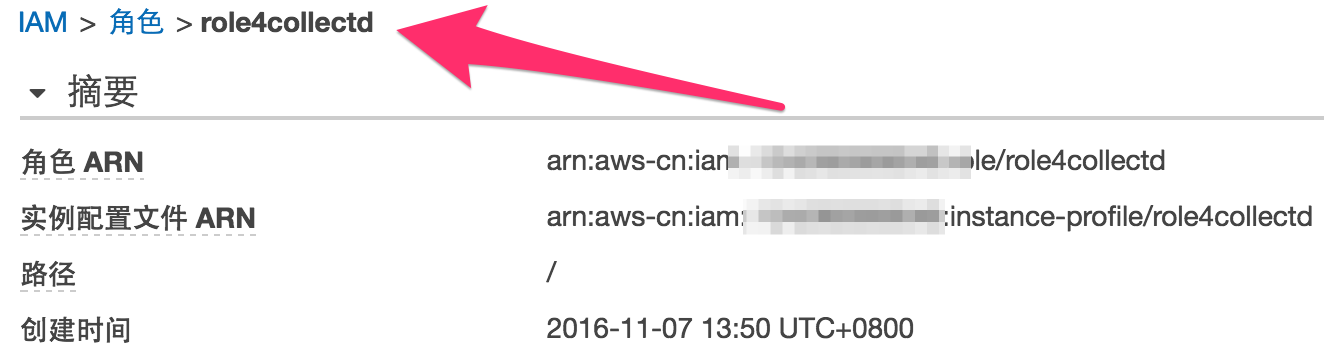
Create a role named role4collectd
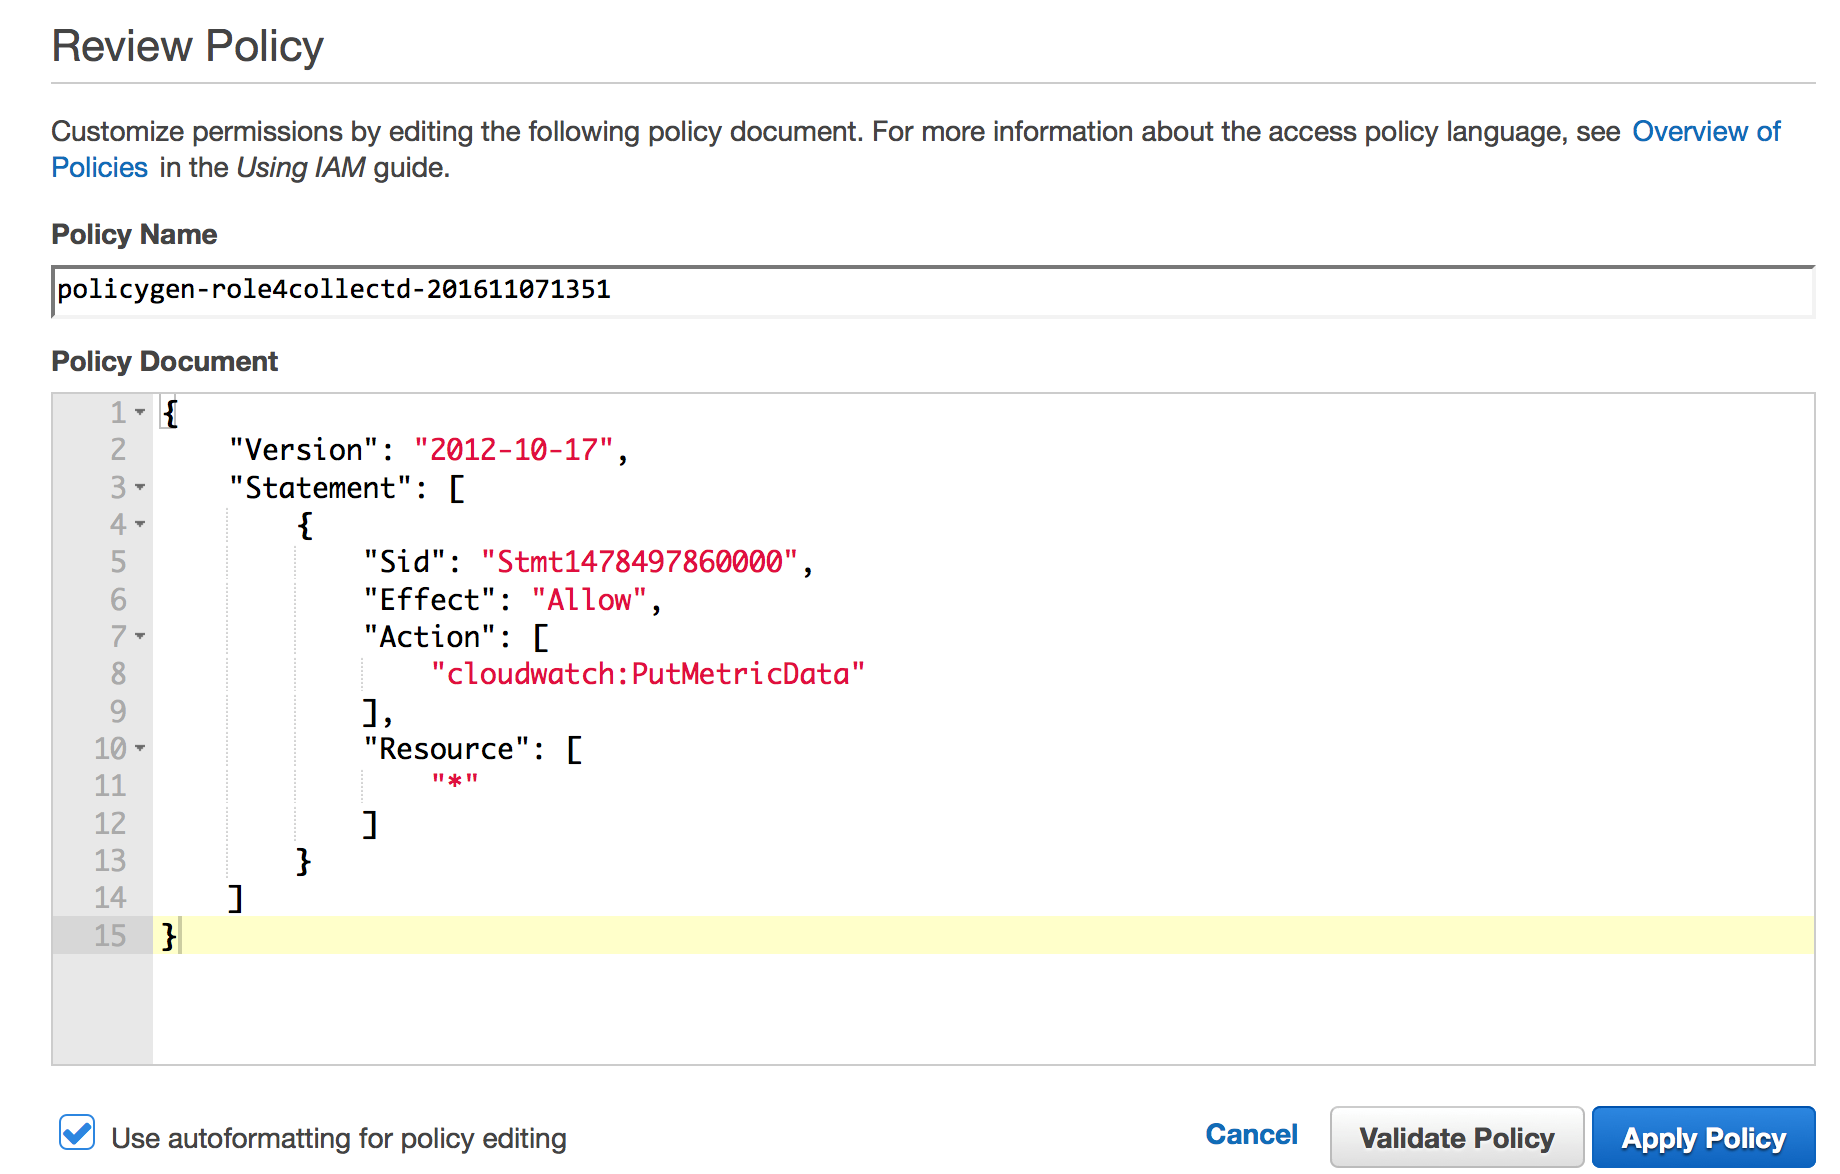
Then, on the role’s permissions page, create a role policy granting this role permission to publish metrics.
Launch Instance and Bind Role
If you want to enable this plugin on an already launched EC2 instance or your own machine, you can skip this step and create an IAM User with CloudWatch metric publishing permissions.
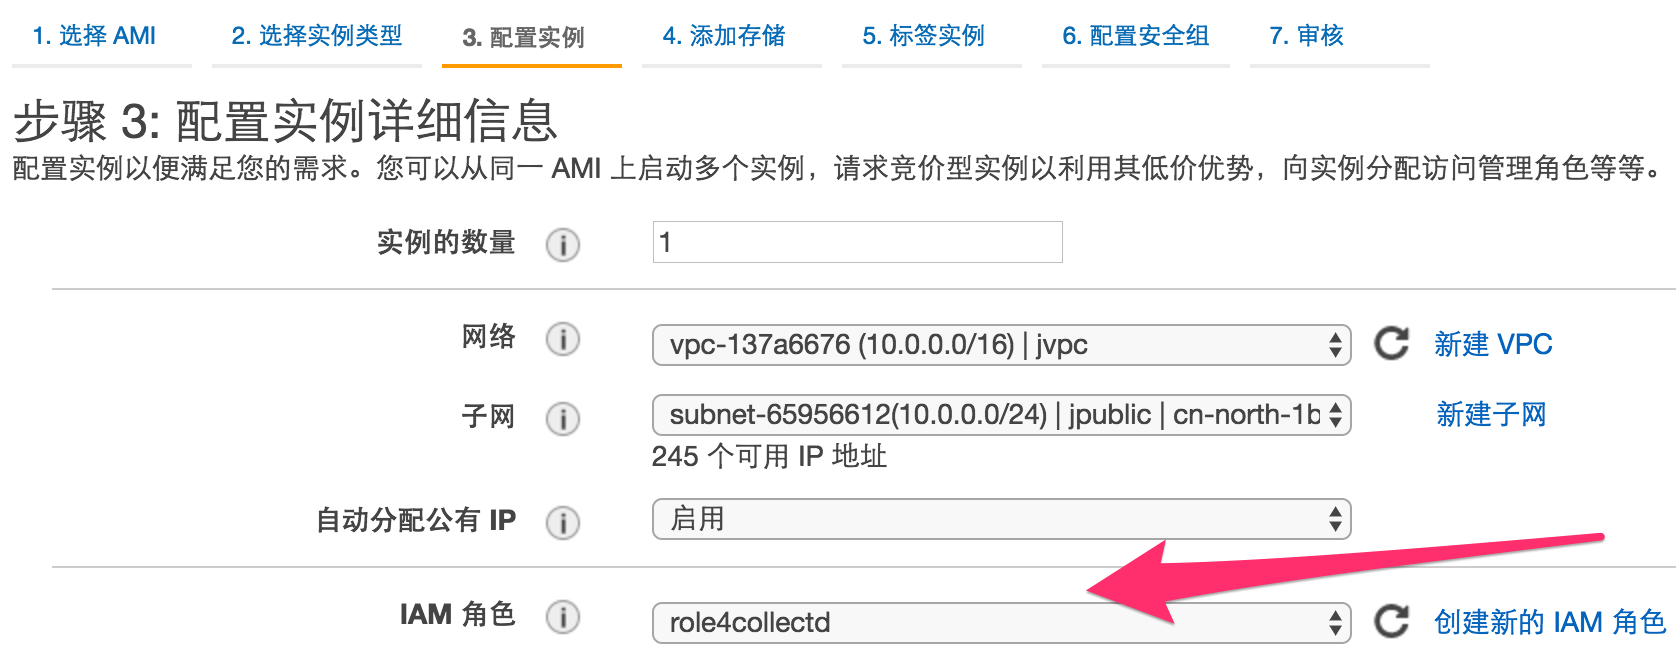
This article launches a new EC2 instance and binds the role created in the previous step:
Install Plugin
Log in to the EC2 instance and update the system.
[ec2-user@ip-10-0-0-6 ~]$ sudo yum -y install collectd
Loaded plugins: priorities, update-motd, upgrade-helper
Resolving Dependencies
--> Running transaction check
---> Package collectd.x86_64.0.5.4.1-1.11.amzn1 will be installed
--> Finished Dependency Resolution
Download the CloudWatch Plugin for collectd installation file and execute it. The installation script will automatically read the EC2 Meta Data, so options like region and the IAM Role bound to the EC2 can be left as defaults.
[ec2-user@ip-10-0-0-6 ~]$ sudo -s
[root@ip-10-0-0-6 ec2-user]# wget https://raw.githubusercontent.com/awslabs/collectd-cloudwatch/master/src/setup.py
[root@ip-10-0-0-6 ec2-user]# chmod +x setup.py
[root@ip-10-0-0-6 ec2-user]# ./setup.py
[root@ip-10-0-0-6 ec2-user]# ./setup.py
Installing dependencies ... OK
Installing python dependencies ... OK
Downloading plugin ... OK
Extracting plugin ... OK
Moving to collectd plugins directory ... OK
Copying CloudWatch plugin include file ... OK
Choose AWS region for published metrics:
1. Automatic [cn-north-1]
2. Custom
Enter choice [1]:
Choose hostname for published metrics:
1. EC2 instance id [i-cc97bc74]
2. Custom
Enter choice [1]:
Choose authentication method:
1. IAM Role [role4collectd]
2. IAM User
Enter choice [1]:
Choose how to install CloudWatch plugin in collectd:
1. Do not modify existing collectd configuration
2. Add plugin to the existing configuration
Enter choice [2]:
Plugin configuration written successfully.
Stopping collectd process ... NOT OK
Starting collectd process ... OK
The installation of collectd and the CloudWatch plugin for collectd is now complete.
Define Metrics Published to CloudWatch
To store and view metric data collected by collectd in CloudWatch, two things need to be done: (1) Install the corresponding collectd plugin, and (2) Add metric whitelists to the CloudWatch plugin configuration file.
View the metric whitelist of the CloudWatch plugin. For versions below collectd 5.5, the default CloudWatch whitelist metrics are empty, meaning no collectd metrics are published to CloudWatch by default:
[ec2-user@ip-10-0-0-6 ~]$ sudo cat /opt/collectd-plugins/cloudwatch/config/whitelist.conf
For available collectd metric data types, you can check the following file to confirm. This file contains metric types that have not been published to CloudWatch. This file is automatically maintained by the system and should not be manually modified:
blocked_metrics plugin.conf whitelist.conf
[ec2-user@ip-10-0-0-6 ~]$ sudo cat /opt/collectd-plugins/cloudwatch/config/blocked_metrics
# This file is automatically generated - do not modify this file.
# Use this file to find metrics to be added to the whitelist file instead.
cpu-0-cpu-user
cpu-0-cpu-nice
cpu-0-cpu-system
cpu-0-cpu-idle
cpu-0-cpu-wait
cpu-0-cpu-interrupt
cpu-0-cpu-softirq
cpu-0-cpu-steal
interface-lo-if_octets-
interface-lo-if_packets-
interface-lo-if_errors-
interface-eth0-if_octets-
interface-eth0-if_packets-
interface-eth0-if_errors-
load--load-
memory--memory-used
memory--memory-buffered
memory--memory-cached
memory--memory-free
Assuming we are interested in memory-related metrics, we can add metric types starting with ‘memory’ to the CloudWatch whitelist:
[ec2-user@ip-10-0-0-6 ~]$ sudo vim /opt/collectd-plugins/cloudwatch/config/whitelist.conf
Enter the following information:
memory--memory-.*
Restart the collectd service:

Note: After default installation and configuration on an EC2 instance in the BJS region, you may encounter errors in the logs. The main reason is that the default installation script does not support the BJS region. For detailed error identification, please refer to the following steps.
Enable debug mode:

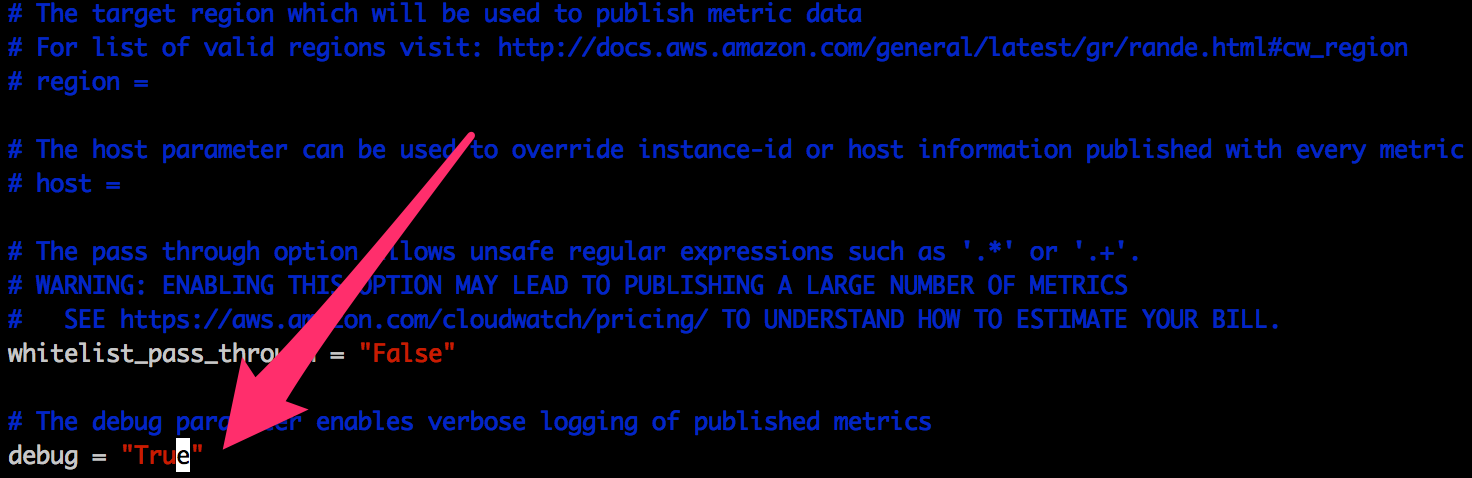
Restart the collectd service:

View the logs:

From the error message below, we can see that the script defaults to publishing metrics to the following endpoint: https://monitoring.cn-north-1.amazonaws.com/. However, the CloudWatch endpoint naming convention for the BJS region differs from that of overseas regions. For detailed AWS BJS region service endpoints, please refer to: China (Beijing) Region;
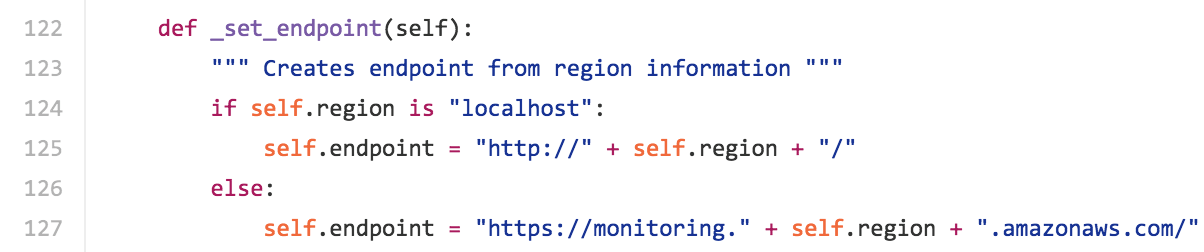
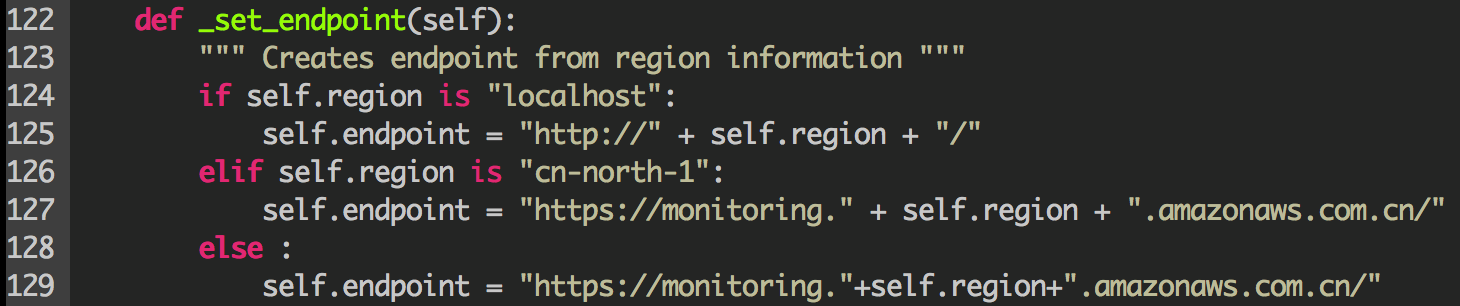
To resolve the endpoint support issue for the BJS region, we need to update the plugin’s Python script file to support the BJS region:
1. confighelper.py file: The default directory after installation is /opt/collectd-plugins/cloudwatch/modules/configuration

Update the following function,
Refer to the modified code below:
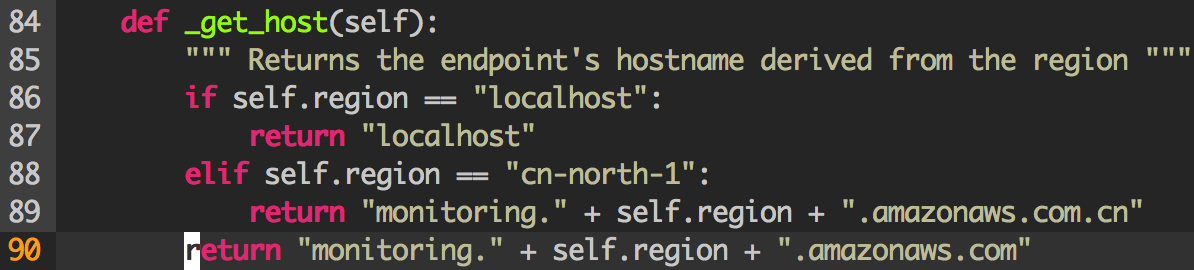
2. requestbuilder.py file: The default directory after installation is /opt/collectd-plugins/cloudwatch/modules/client
The main function of this class is to build Signature Version 4 PutMetricData API requests, so it uses endpoint information. For details, please refer to the online documentation:

Update the following function,

Refer to the modified code below:
Restart the collectd service:

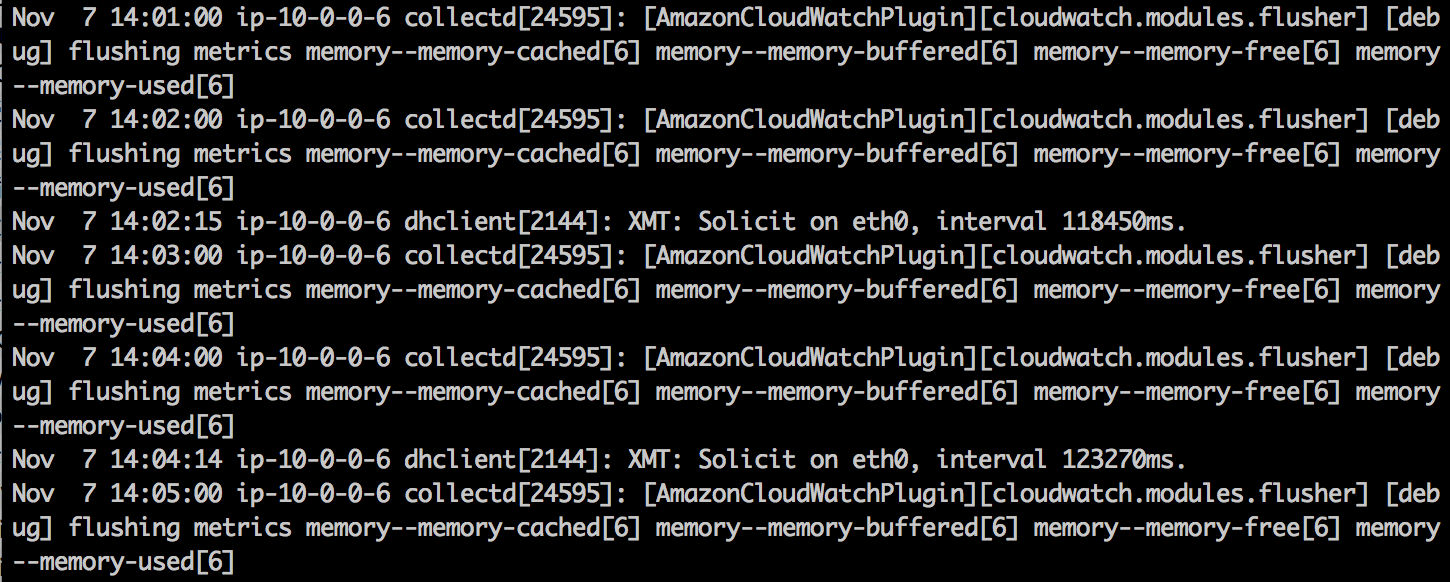
View log content starting with [AmazonCloudWatchPlugin]. From the logs, we can see that the memory-related logs added to the whitelist contain four different metrics, published once per minute:

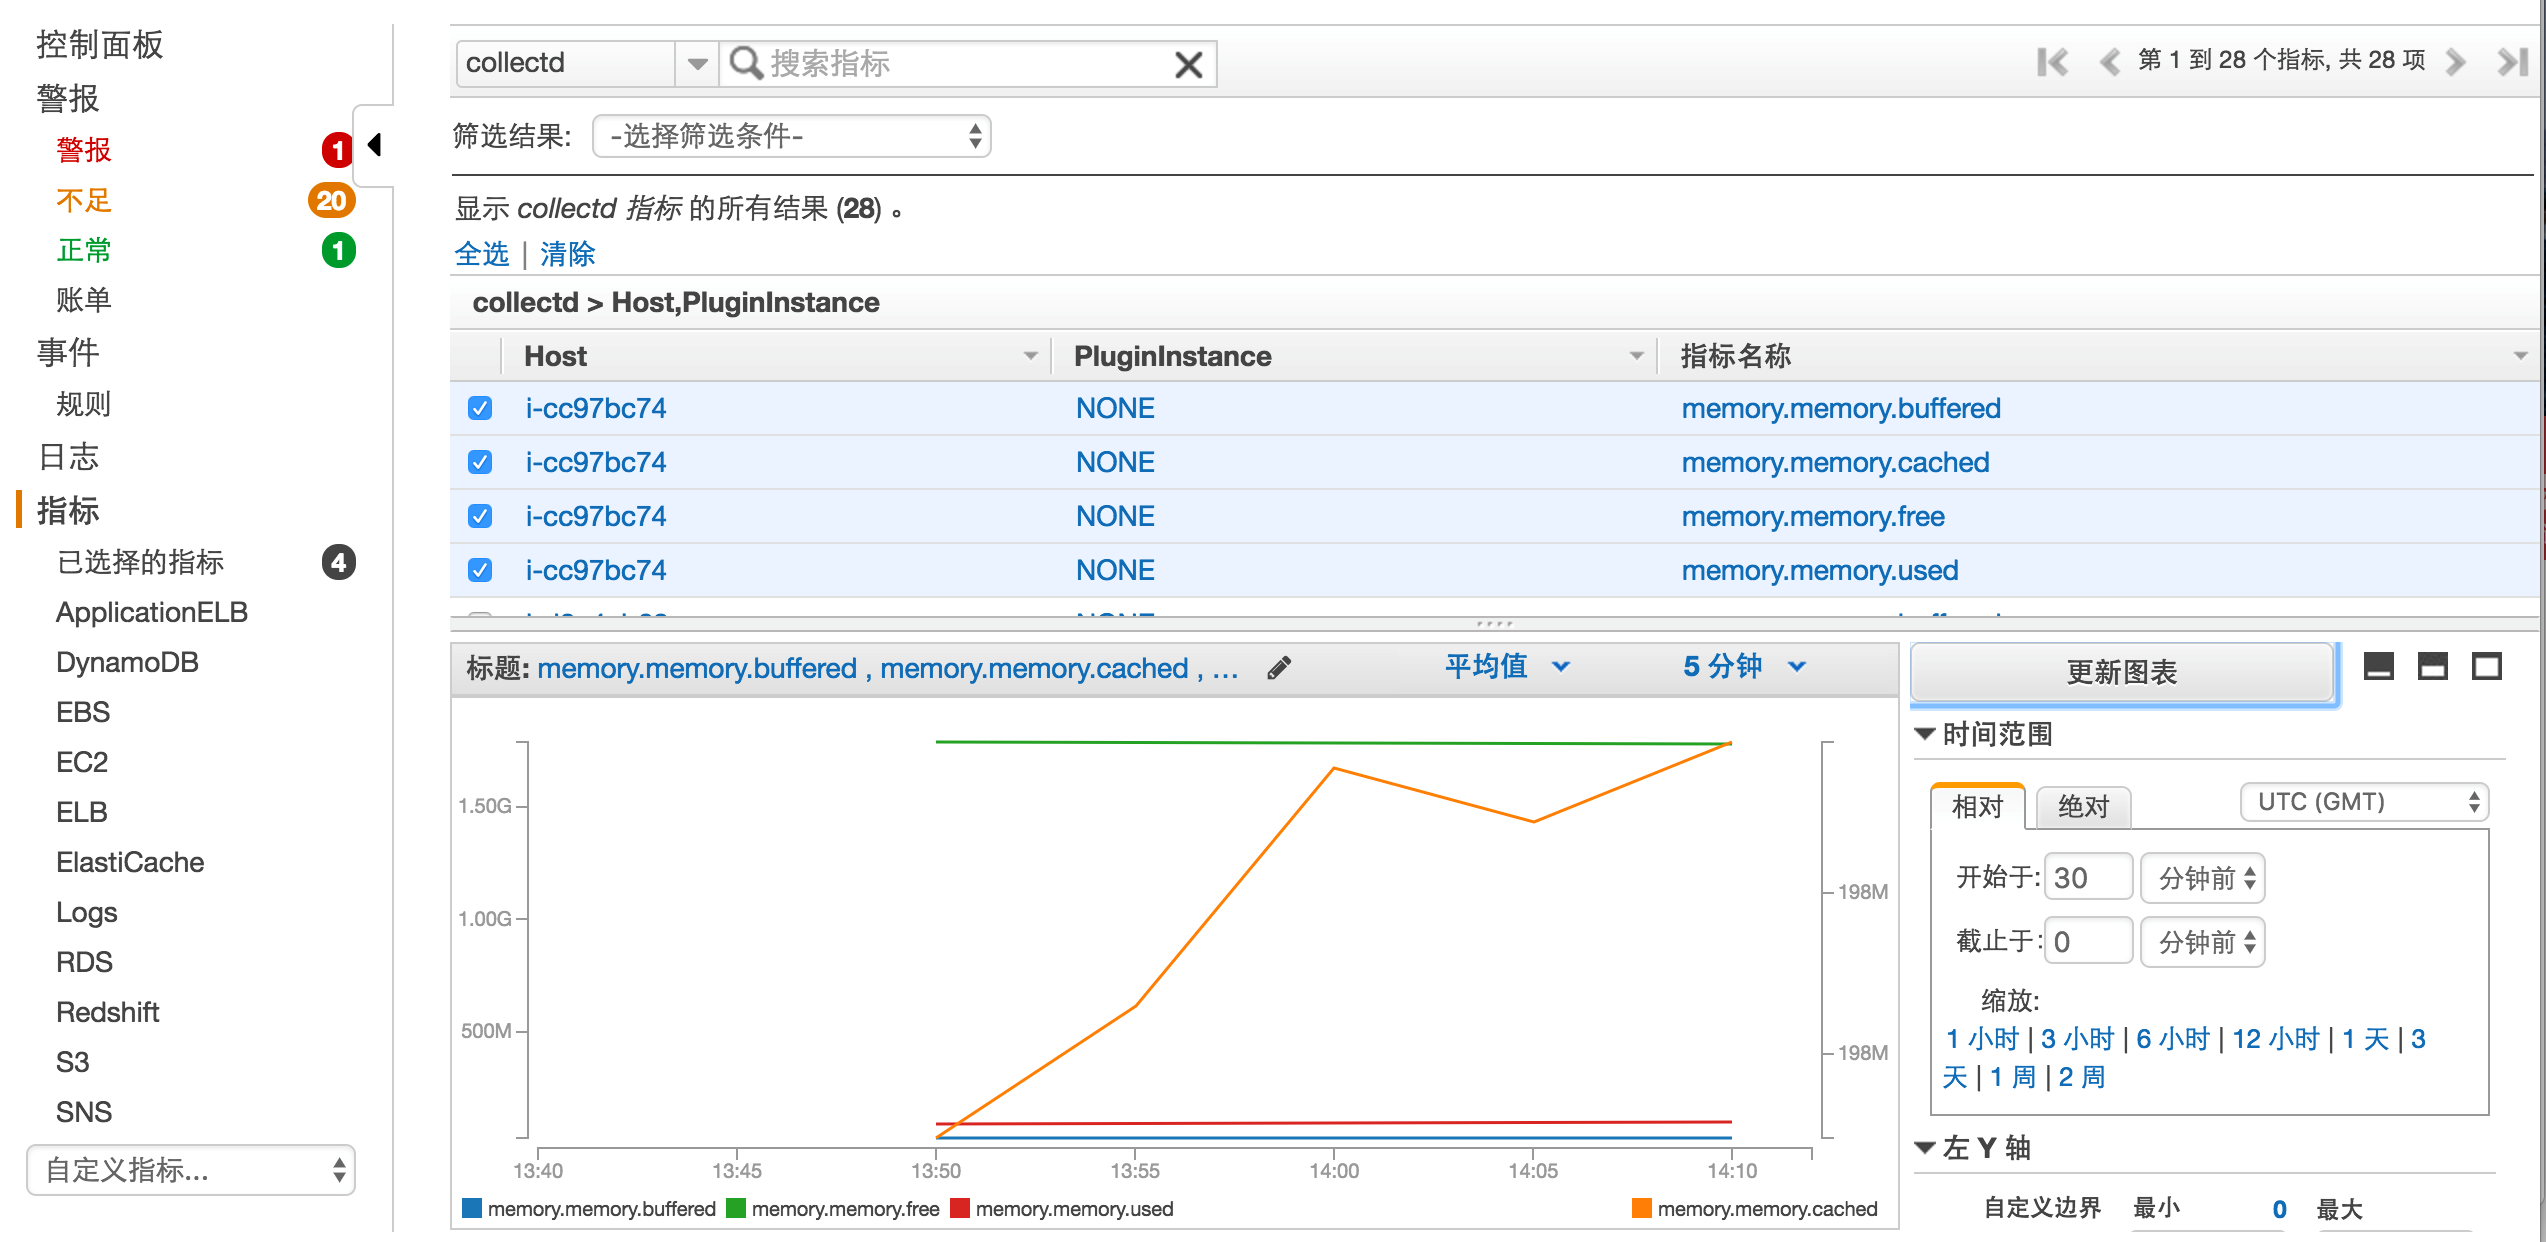
Log in to the AWS Console, open the CloudWatch page. At the bottom of the left navigation, there is a checkbox for custom metrics. Selecting it allows you to choose collectd to view the just-published metric content:
Install and Enable the Apache Monitoring Data Collection Plugin
If the Apache Web server is not installed or configured, please refer to the Tutorial: Installing a LAMP Web Server on Amazon Linux to set up the Web server environment.
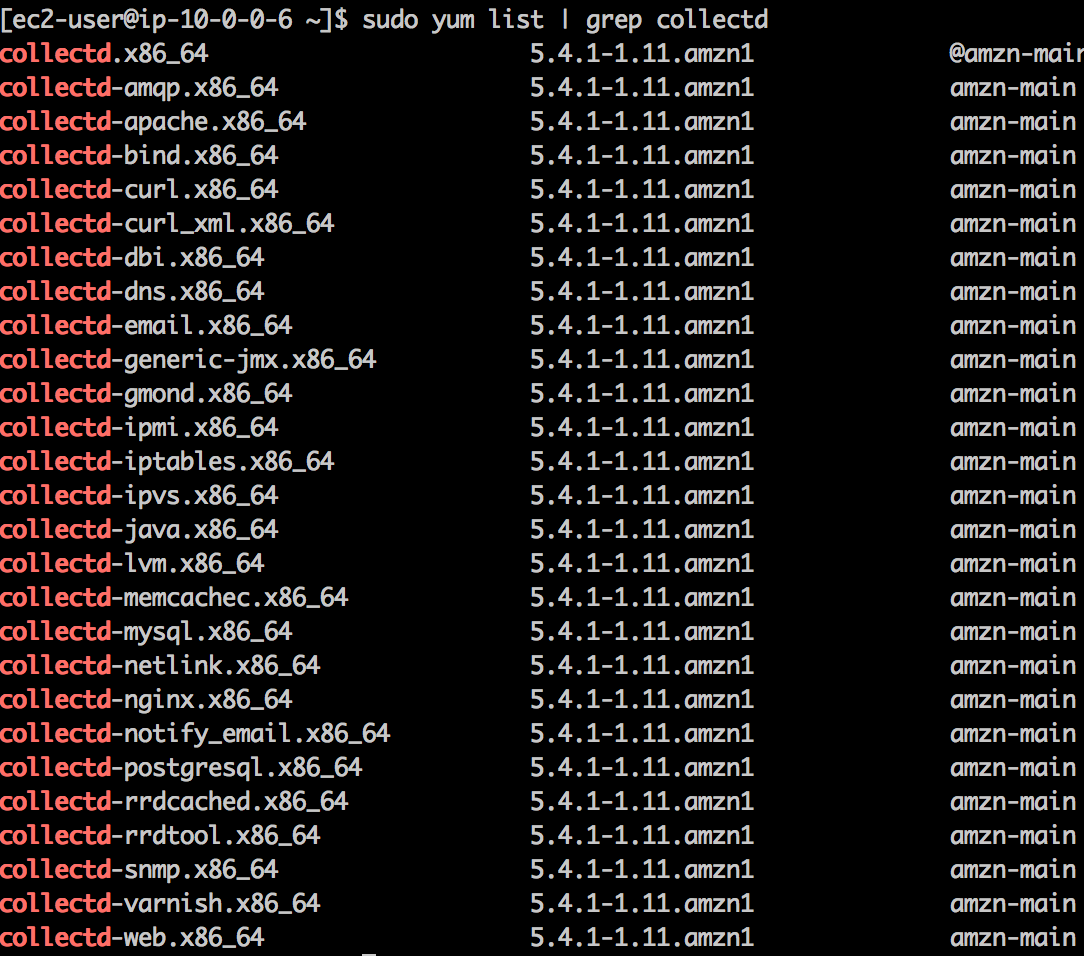
You can query the list of collectd plugins included in the Amazon Linux AMI using the following command:
Apache status information comes from its own mod_status module, and collectd parses metrics such as transferred bytes and received request counts. For details, please refer to this plugin introduction page; Install the collectd Apache monitoring plugin:

Modify the collectd configuration. The default installation file location is /etc/collectd.conf:
LoadPlugin apache
<Plugin apache>
<Instance “local”>
URL “http://localhost/server-status?auto”
</Instance>
</Plugin>
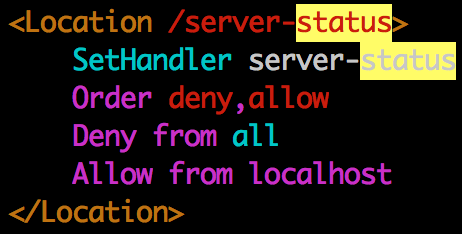
Below is a reference configuration for the httpd-2.2 version. The default configuration file is located at /etc/httpd/conf/httpd.conf:
Add Apache-related status metrics to the whitelist list of the CloudWatch collectd plugin configuration. Update the file /opt/collectd-plugins/cloudwatch/config/whitelist.conf:
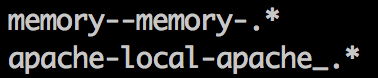
Restart the relevant services:
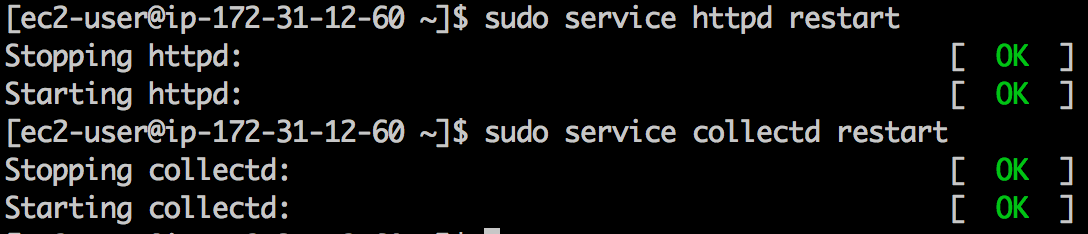
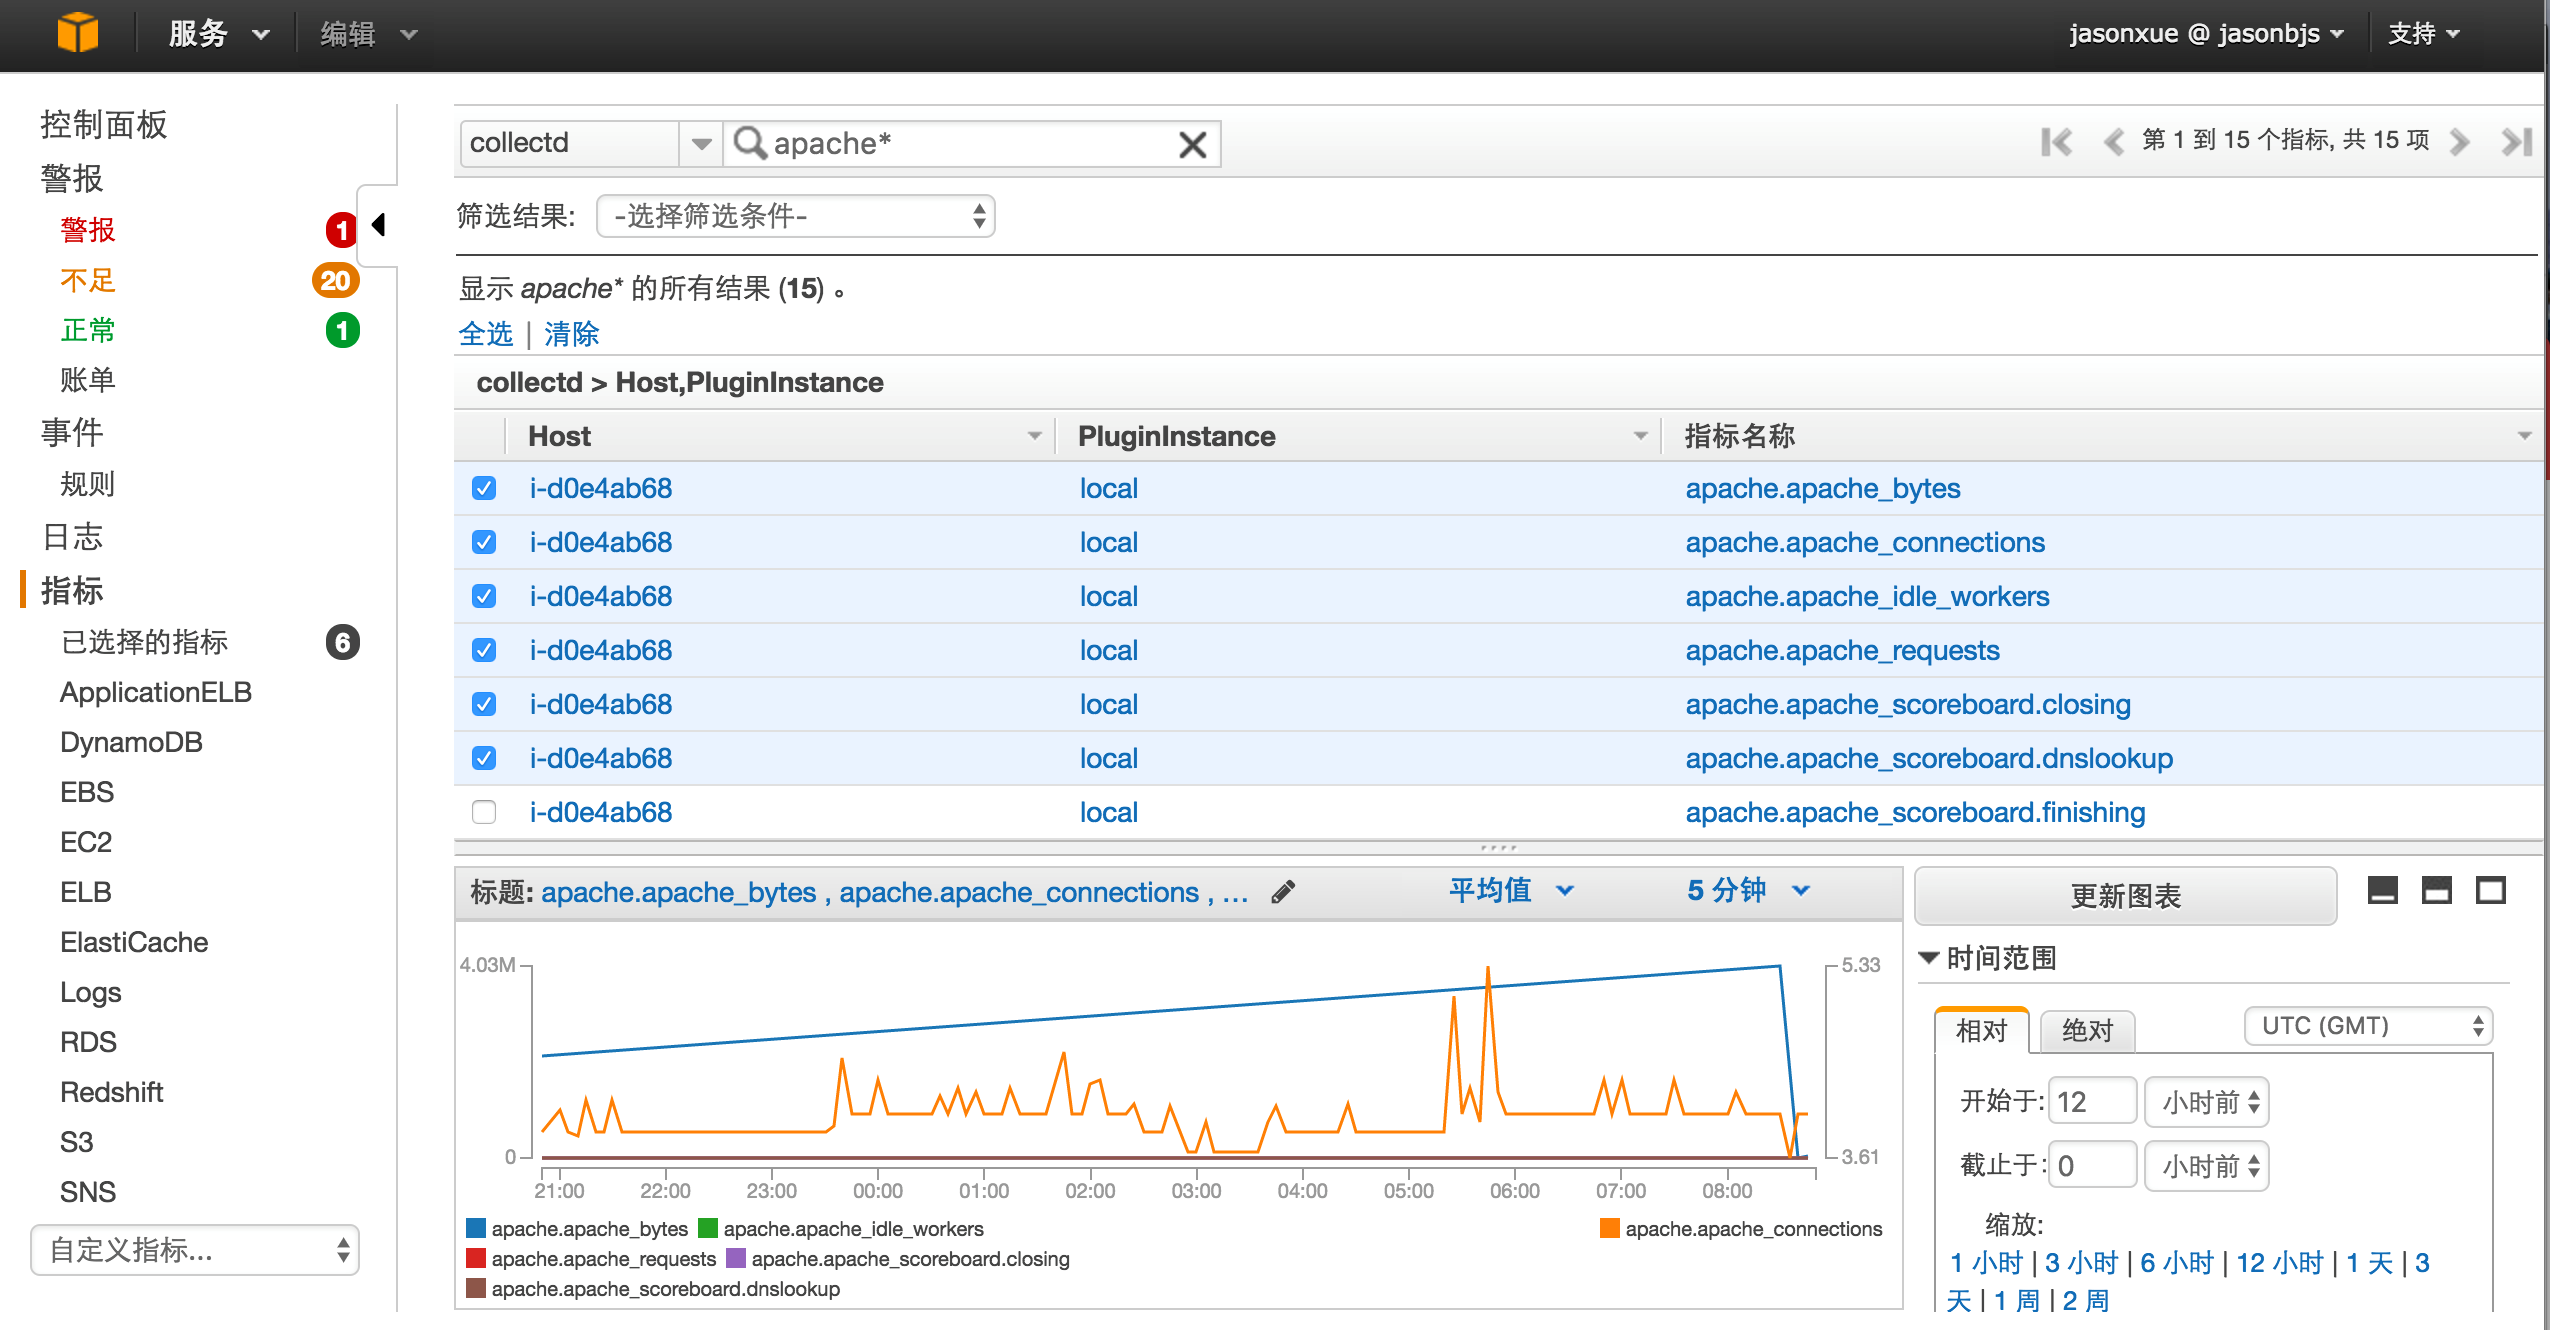
Thus, we have completed the installation and configuration of the new collectd Apache plugin and added Apache-related monitoring metrics to the CloudWatch whitelist. This allows us to seamlessly integrate collectd’s data collection capabilities with CloudWatch’s unified storage, display, and alerting capabilities. The figure below shows the result of displaying Apache web application-related metrics in CloudWatch:
Creating Alarms Based on CloudWatch Metrics
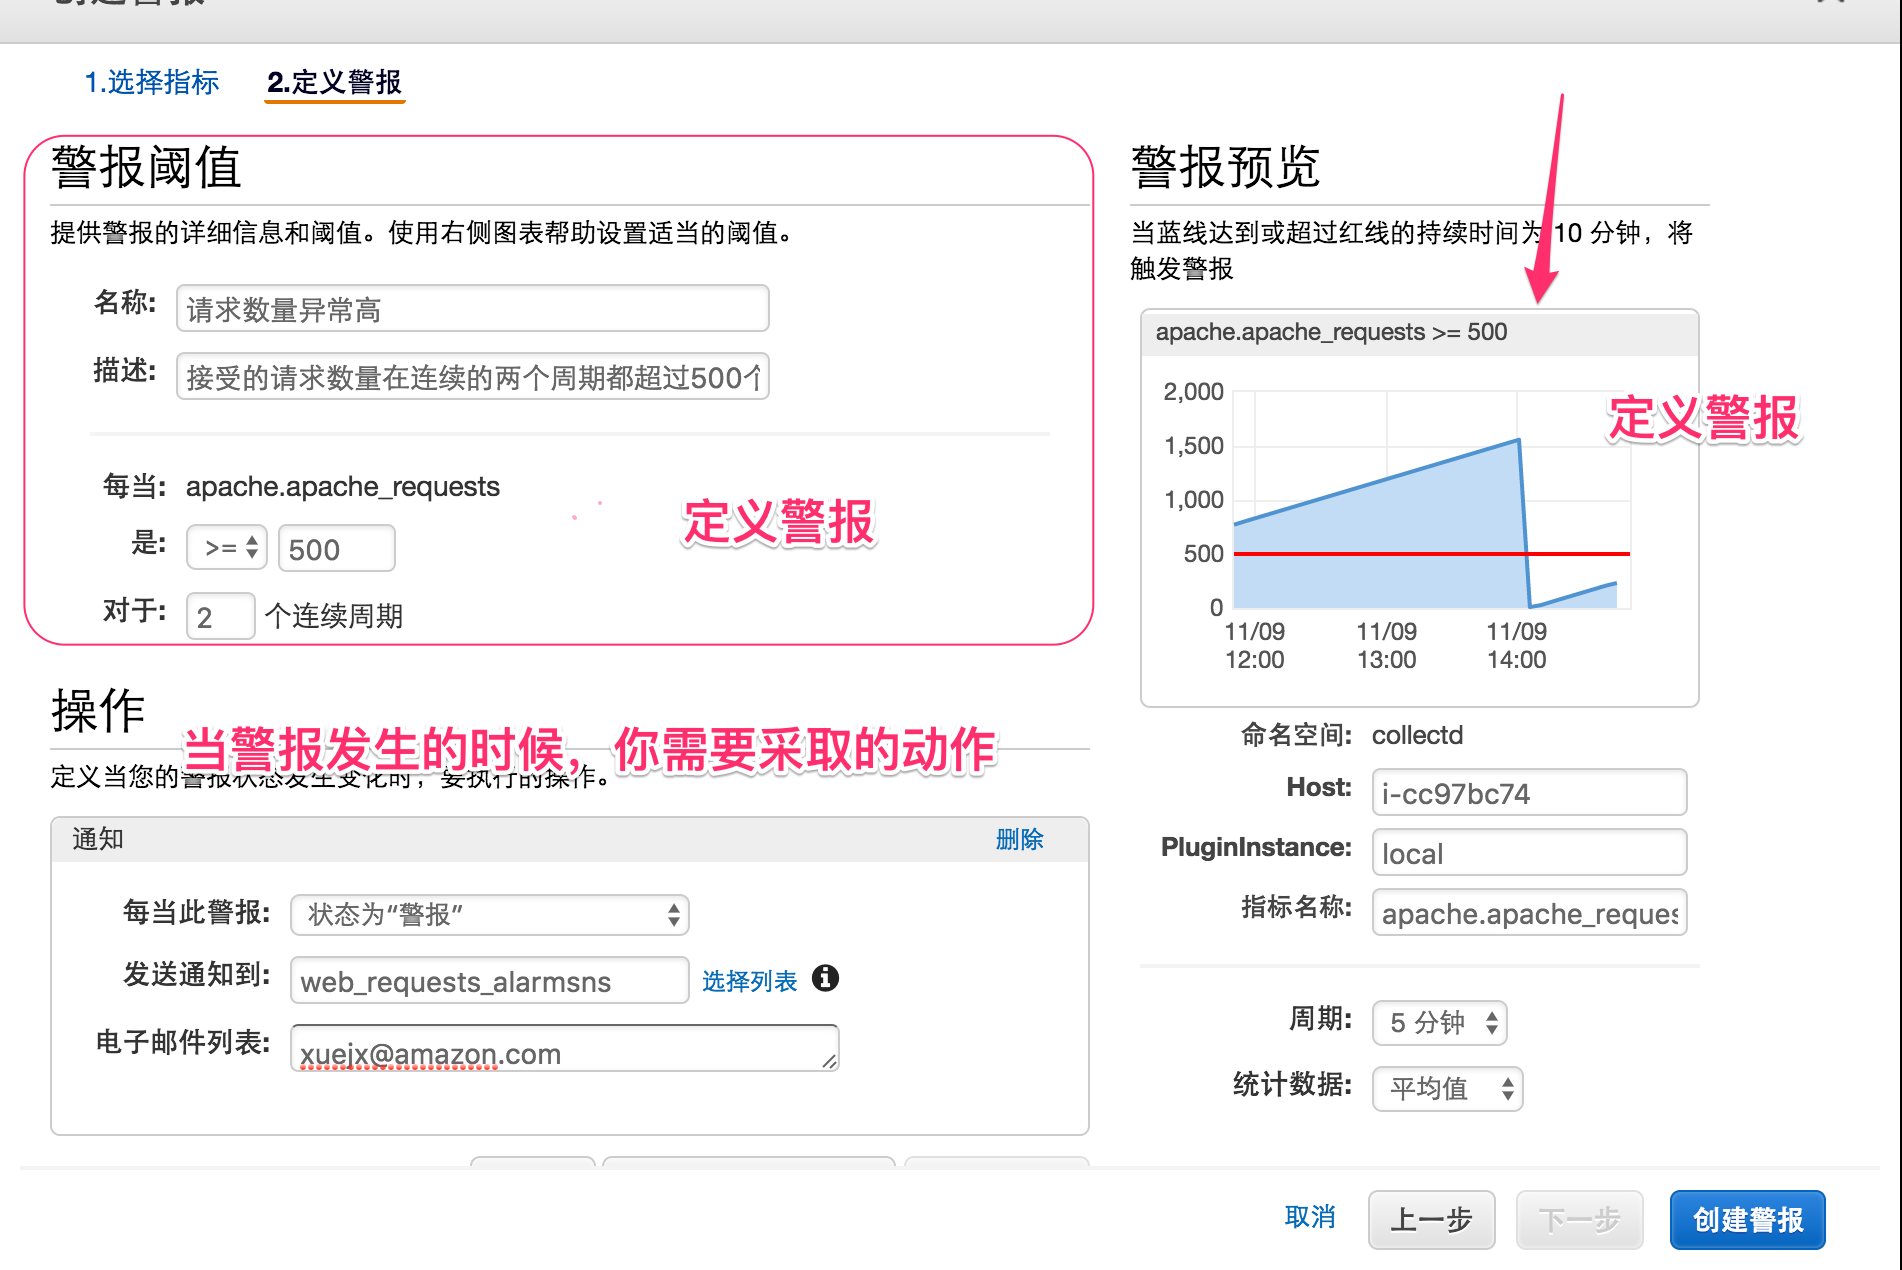
Since we have collected many system and application metrics via plugins, how do we respond and handle them if abnormalities occur or predefined thresholds are exceeded? Ideally, we can automate responses to these alarms, i.e., build a “hands-free” monitoring and alerting platform. The figure below is a screenshot of defining an alarm based on a specific collected metric and handling the alarm actions. When an alarm occurs, you can define one or more actions to respond and handle it. Action types include sending email notifications, publishing messages to SNS services, adding Auto Scaling actions, and EC2 instance actions. EC2 instance actions include stopping, terminating, rebooting, or recovering instances. Any EC2 instance metric (in the AWS/EC2 namespace) or any custom metric containing the “InstanceId=” dimension can trigger EC2 instance actions in an alarm.
Some Limitations
Many users are very concerned about performance issues when first encountering CloudWatch. Currently, the metric publishing API PutMetricData can handle 150 transactions per second (TPS). This is the maximum number of operational requests you can send per second without being throttled, but you can request limit increases online; PutMetricData supports both GET and POST operations, with maximum request sizes of 8KB and 40KB respectively. Each metric can have up to 10 dimensions;
Summary
In this article, we learned together how to build a hands-free monitoring and alerting platform based on CloudWatch and related collectd plugins. CloudWatch provides basic monitoring data for AWS resources by default and offers CLI and REST API methods for users to extend custom business and system metric data. The CloudWatch plugin for collectd is a newly released open-source plugin by AWS. Everyone can further learn how to extend and integrate AWS services based on Python by studying the source code of this project.